Data Practices Chapter 6 – Access and Equity
- Date: February 18, 2022
Jump to section
Transit riders are diverse and have diverse needs. Different groups—minorities, low-income, seniors, students, or others—may ride different routes, travel for different reasons or at different times of the day, or pay for transit differently. Conducting equity analysis or accessibility analysis can help agencies understand the varied needs and travel patterns of riders in their service area. Equity analysis ensures that service changes provide the same service levels to minority and low-income riders and that fare changes do not harm any group. Accessibility analysis examines the number of destinations, often jobs, that are accessible via transit within a certain time frame, which allows an agency a better understanding of how riders use their services. Data allows this analysis to happen, and new tools and data sources provide richer answers to these questions.
Focusing on access and equity can help agencies understand how different riders use transit services and how to meet their needs better.
Access and Equity
Service Equity Analysis
When service changes are proposed, conducting a service equity analysis ensures that minority and low-income riders receive the same service as other riders.
Customer Profiles
Different riders may use transit differently. Understanding customer profiles helps planners understand how different groups ride, including the routes they use or the fare media they rely on.
Accessibility Analysis
Accessibility analyses determine which destinations or jobs a person can access within a certain time frame on public transit, which helps planners understand how the service can be used by a potential rider.
Fare Equity Analysis
Different groups may also pay fares differently. Fare equity analysis examines the impact that fare changes have on different groups to ensure that minority or low-income riders are not harmed.
Trip Purpose Analysis
Trip purposes extend beyond commuting. Collecting trip purpose information from riders can help agencies plan routes to meet riders’ needs.
Trip Planning Accessibility
Offering access to trip planners helps riders plan their trip using transit. Providing a GTFS feed to trip planners or including a trip planner on an agency website helps riders easily understand the service and plan their trip.
Introduction
Transit agencies seek to provide transit services across their service area, but the people living, working, and traveling in the service area are not uniform. Different groups of people may take different trips, use different routes, or pay for transit differently, and transit service may serve some trips or needs better than others. Access in transit typically examines the number of destinations, often jobs, that riders can access within a fixed amount of time. Equity in transit is the value that degree of need should be considered when determining how resources are allocated. Data provides a means to assess who transit serves and how well it serves them. New tools and data sources provide the means to answer questions of access and equity with richer detail and actionable insights.
Evaluating accessibility to key destinations and jobs is an emerging trend in the industry. Transit agencies have begun to pay more attention to accessibility metrics, which examine how well transit provides connections to key destinations. Although equity analysis is required through Title VI, there are opportunities for agencies to more thoroughly address these questions. Equity reports that go beyond federal requirements are being conducted in places like San Francisco and may soon be repeated in other jurisdictions. Access is one lens through which equity can be evaluated. In addition, asking the right questions is the most important part of an equity analysis. Consider the many dimensions of equity as you frame your research questions. Equity considerations include service offered, fare payment types, trip purpose analysis, and trip planning accessibility. If there is a riders’ advocacy group in your service area, they may be helpful in highlighting the right questions to ask.
Practices to Increase Access and Equity with Data
Transit agency data allows agencies to examine access and equity questions. This includes service equity analysis and fare equity analysis, understanding customer profiles and the reason they take trips, accessibility analysis, and making trip planning accessible to riders. Table 8 shows the topics covered in this chapter, the questions that each asks, the data required for each, and the method.
| Category | Input Data | Method | Analysis |
| Service Equity Analysis | Schedule data, Census data | Title VI-style analysis of demographics at stop locations with proposed service changes | Will service changes disproportionately affect minority or low-income customers? |
| Accessibility Analysis | GTFS schedule data, OpenStreetMap data | Generate travel time isochrones using GIS software | What areas can you reach on public transit in a limited amount of time? |
| Fare Equity Analysis | Fare payment data | Estimate the amount of fares paid by demographic group under current and proposed fares | Will fare changes result in a disparate impact on protected populations? |
| Customer Profiles | Customer survey data | Create crosstabs of survey data by demographic characteristics at the route and systemwide level | Are certain routes critical to high- need groups? Are certain types of fare media (senior discounts, student fare cards) used effectively? |
| Trip Purpose Analysis | Demand Response customer demographic and trip information data | Create crosstabs of survey data and make inferences on trip purpose from other available data | Are there needs to increase services for particular demographic groups or trip types (e.g., Medicaid trips)? |
| Trip Planning Accessibility | GTFS schedule data | Upload feed to trip planning providers or host trip planning service on the agency website | More accessible trip planning for customers. |
Service Equity Analysis
Service areas are not homogenous, and neither are the populations within them. The Federal Transit Administration (FTA) requires transit agencies that provide fixed-route service, operate 50 or more fixed route vehicles during peak service, and operate in an urbanized area with a population of at least 200,000 analyze the effects of service changes specifically for minority and low-income populations, as stipulated in FTA’s Title VI Circular.60 The purpose of a Title VI analysis is to determine if minority or low-income populations bear more of the burden of service reductions or if they receive fewer of the benefits of service additions. Even if an agency is not required to evaluate service changes, analyzing service offerings and changes and how this affects minority and low-income populations can help an agency understand if its services are equitable.
If an agency is required to complete a Title VI Program by FTA, the Title VI Program must include the following definitions:
Major Service Change Policy:
This defines which service changes warrant a Title VI analysis. This may include a percentage of a route that changes, a system-wide change, and the number of people affected by the change. This applies to changes that add or reduce service.
Adverse Effects Definition:
This explains the type and magnitude of changes that represent adverse effects. This can include the elimination of a route or stop, shortlining a route, rerouting, headway changes, or span changes.
Disparate Impact (DI) Policy:
This is the threshold at which an impact is considered substantially different from the service area average for minority populations. For example, if the percentage of minorities in a service area is 30 percent, but service is removed from an area with 50 percent minority populations, this likely exceeds the threshold for a disparate impact.
Disproportionate Burden (DB) Policy:
This is the threshold at which an impact is considered substantially different from the service area average for low-income populations. For example, if the percent of low-income households in a service area is 30 percent, but service is removed from an area with 50 percent low-income households, this likely exceeds the threshold for a disproportionate burden.
To complete a service equity analysis (SEA), an agency needs to collect census data about populations in the service area, including minority and low-income populations. Each agency can determine the threshold for low-income households based on the federal poverty level, median income in the service area, or other criteria chosen by the agency. Minority populations consist of people who identify as:
- American Indian and Alaskan Native
- Asian
- Black or African American
- Hispanic or Latino, regardless of race
- Native Hawaiian or Pacific Islander.
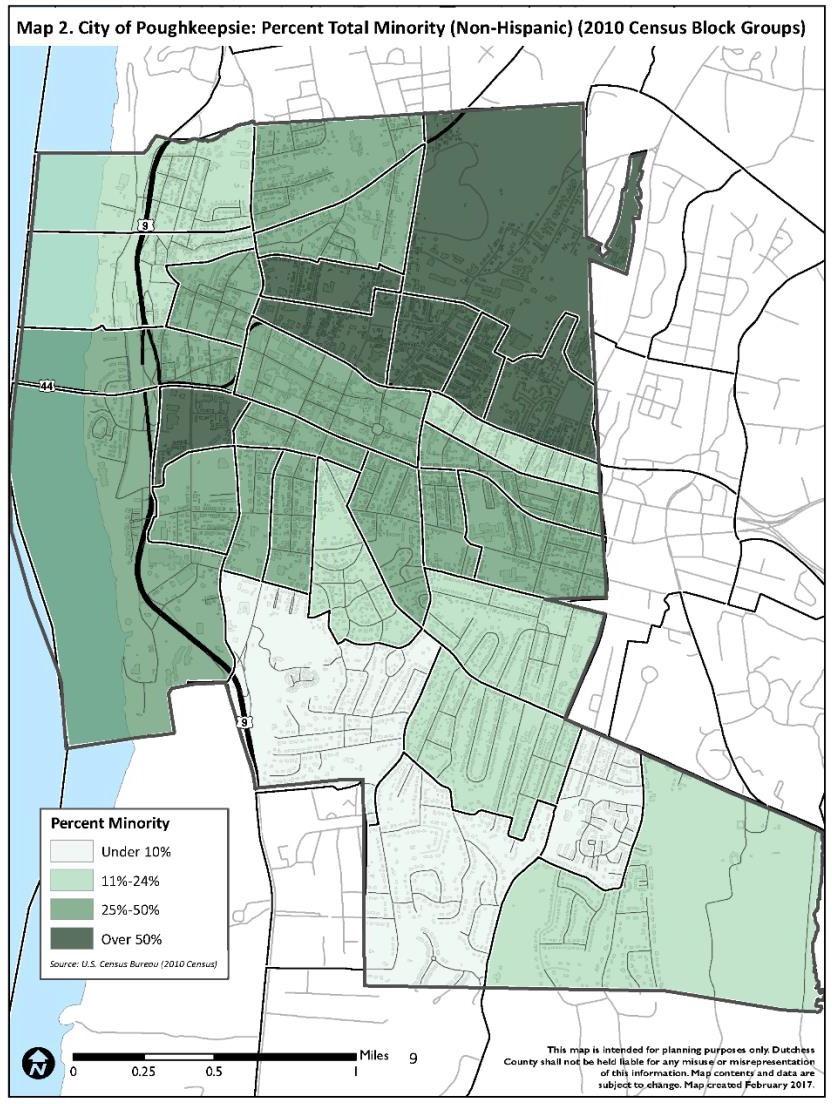
Supporting maps illustrating where these populations live in a service area can be useful for illustrating where changes to service could imposed a disproportionate burden or a disparate impact, as shown in Figure 33. Whenever possible, the color breaks used to illustrate these figures should be changed to include the DB and DI thresholds appropriate for the service area.
Figure 33. Example Map of Minority (Non-Hispanic) Populations for Service Equity Analysis 61
The agency also needs to collect information about service levels before and after a proposed service change. This information includes route headways, span of service, number of trips, and stop locations. The analysis can be completed by route, if only a few routes are changing, or at the system level if more than a few routes are changing.
61 Dutchess County Department of Planning and Development. “Title VI Service Equity Analysis: Dutchess County Public Transit Service Expansion in the City of Poughkeepsie”. March 1, 2017. View the reference document here (external link)
To do this, data from a GTFS feed for existing services can be compared to a GTFS feed that includes the proposed service. Though other data sources can be used for this purpose, using GTFS feeds allows for more granular analysis of service changes and a more repeatable analysis. For example, this analysis can examine service levels at the stop level, taking together the effect on non-changing routes and multiple routes that change simultaneously to understand the resulting service at the stop level.
Follow these steps to complete an SEA:
If impacts are identified, this is called a disparate impact (DI) when minorities are affected and a disproportionate burden (DB) when low-income communities are affected. If a DI is found, transit agencies must either enact an alternative plan that minimizes the effect on minority populations or provide a substantial legitimate justification for the chosen service plan. If a DB is found, the transit agency must evaluate alternative policies and mitigate the burden where possible.
The FTA requires service equity analyses to ensure that minority and low-income populations receive equitable transit services. Conducting a service equity analysis allows an agency to understand the equity implications of service changes. Using GTFS feeds for existing and proposed services allows agencies to examine service changes at a more granular level, providing a more thorough understanding of the impacts of service changes.
Accessibility Analysis
While a basic analysis of a transit system might include the number of people a route serves or even the number of jobs accessible along a route, an accessibility analysis can deepen the rigor of the analysis. Analyses of these kind estimate the time a person must spend on the transit system in order to access jobs or destinations. An estimate of accessibility from a single location, or an isochrone, is the most basic form of this analysis. An isochrone is a summary of the travel paths that a person could take from or to a point under a certain time limit, such as 60 minutes. The result is a boundary shape that shows the total area that a person can access given the existing transit service in a specific amount of time. When combined with information about destinations like jobs, the amount of opportunities accessible to a person from a given point can be quantified.
Accessibility analysis provides a more realistic perspective on how riders will actually use the system. In practice, many riders will find that travel time limits their ability to use transit, especially if they also have the option of using a personal vehicle or another mode of transportation to complete their trip. Compared to simply examining route coverage, isochrone analysis can help synthesize the accessibility generated from route transfers.
To conduct this analysis, a transit agency needs to collect GTFS feed information about the transit service, the number of jobs available throughout the service area, and GIS software to conduct the analysis and an underlying network. There are a number of options, using both free (QGIS) and proprietary (ArcGIS) software, to perform isochrone analyses, including:
- TravelTime plugin for QGIS
- Hqgis for QGIS
- Network Analyst in ArcGIS by ESRI
- Generate Service Area tool in ArcGIS Pro by ESRI.
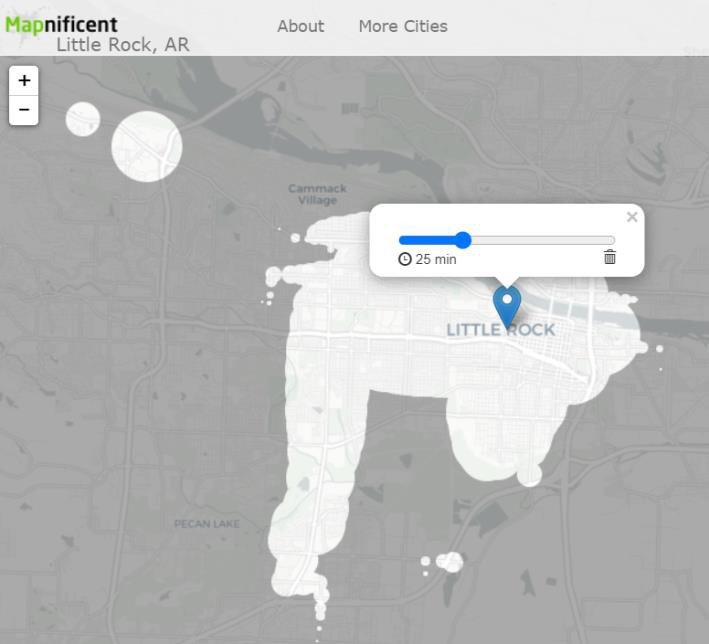
Easy to Use Isochrones: Mapnificent
Mapnificent.net shows areas accessible by transit in a number of cities throughout the United States. A user can move the starting point to a variety of areas and change the total travel time. The resulting polygon indicates areas that are reachable by transit from the starting point in the given time.
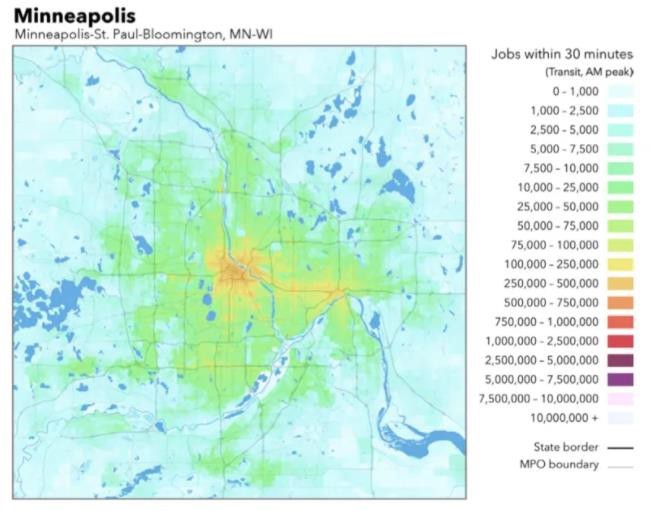
Accessibility Statistics: Access Across America
The University of Minnesota produced a set of maps showing job accessibility by transit for a number of metropolitan areas.62 The maps show the total number of jobs that can be accessed within 30 minutes of travel time during the AM peak.
Fare Equity Analysis
Different groups of riders use transit and pay for transit differently. Agencies can use data from smart fare cards to understand these different groups’ needs, and this can also help agencies understand how a fare change may have different impacts on different users. To better understand the equity impacts of a fare change, agencies can conduct surveys or other analyses to evaluate the impact that a fare change may have on low-income or minority riders.
Low-income riders are one example of a group that is likely to use transit and pay for transit differently than other riders. Low-income riders are more likely to:
- Travel shorter distances
- Take more frequent transit trips 63
- Make more transfers 64
- Pay for each ride separately rather than use a multi-day or monthly unlimited pass65
- Be unbanked or underbanked and rely on cash transactions.66
This means that raising flat fares, cash fares, and transfer fees will disproportionately harm low-income riders. Low-income riders, especially those that are unbanked or have low savings, may have trouble paying the up-front cost of a pass, even if they would benefit from using the pass rather than paying per ride. Fare capping, which is a pay-as-you-go option that automatically issues a pass after paying the equivalent cost through single ride fares, has the potential to address this need but requires technology to enable this on smart fare cards or through mobile apps. An agency that uses smart fare cards can analyze the need for fare capping by examining data they collect with smart fare cards. Are there riders who pay more per month in single fare rides than the cost of a monthly pass? If so, fare capping may be a strategy to address this.
Fare Capping on The Rapid
The Rapid in Grand Rapids, Michigan, offers daily, weekly, and monthly fare capping.67 After riding the bus twice in one day, a rider using a Wave card will receive a daily pass and will not be charged for additional trips on that day. The same is true for weekly and monthly passes. This benefits low-income riders who may not be able to pay for the upfront cost of a pass but also benefits riders who do not know how often they will ride.
Corpus Christi Fare Change Analysis
In an analysis of proposed fare changes, the Corpus Christi Regional Transportation Authority in Nueces County, Texas conducted a survey to better understand how minority and low-income riders would be affected. They collected data about the trips that riders in each group took and then calculated the price each group would pay under the existing fare structure as well as under the proposed fare structure. They found that raising off-peak fares and charging for transfers disproportionately harmed low-income populations, although it did not disproportionately harm minority populations.
62 University of Minnesota. 2017. “Access Across America: Transit 2017.” Accessibility Observatory. View the reference website here (external link)
63 Cornelius Nuworsoo, Aaron Golub,and Elizabeth Deakin. 2009. “Analyzing Equity Impacts of Transit Fare Changes: Case Study of Alameda-Contra Costa Transit, California.”Evaluation and Program Planning 32 (4), 360-368. View the reference article here (external link)
64 Jeffrey Rosenblum. 2019. “How Low-Income Transit Riders in Boston Respond to Discounted Fares: A Randomized Controlled Evaluation.” Massachusetts Institute of Technology, Department of Urban Studies and Planning. View the reference article here (external link)
65 Rosenblum. “How Low-Income Transit Riders in Boston Respond to Discounted Fares: A Randomized Controlled Evaluation.”
66 Federal Deposit Insurance Corporation. 2020. “How America Banks: Household Use of Banking and Financial Services.” View the reference document here (external link)
67 The Rapid. n.d. “The Wave Benefits.” View the reference website here (external link)
Customer Profiles
While agencies may have general ideas about who rides their services, it is helpful to collect more specific data about ridership: who is riding and for what purposes. One way to do this is by conducting rider surveys periodically to gather demographic and trip data. Important demographic information to collect includes age, household income, race, language spoken at home, ability to speak English, and employment status (including retired and student). Travel information includes the type of fare paid (e.g., regular fare or discount), fare media used (e.g., smart fare card, mobile app, cash), route used, number of transfers taken, trip purpose, and trip frequency.
Customer profiles allow agencies to extract basic information about how their service is used so they can make changes that make customers’ travel easier. For example, are there specific improvements that many riders would like to see in the service? Are there common transfer points between routes that might warrant combining routes?
It is possible to create crosstabs to gain valuable information about how specific riders use transit services. For example, are students and seniors using fare discounts that they are eligible for? Are low- income riders more likely to pay in cash or transfer more often? Are there particular routes that are more heavily used by speakers of languages other than English? Depending on the answers to these questions, an agency might determine to post notices in other languages on certain routes, advertise fare discounts more widely, or avoid raising transfer fare prices.
Trip Purpose Analysis
Transit riders use transit for many different purposes. While riders on larger systems primarily use transit to access a job, many riders on smaller systems are instead riding to access services, such as retail, medical, educational, or social services. Understanding riders’ reasons for travel can help an agency better meet those needs. There are several ways to obtain information on customers’ trip purposes or infer trip purpose:
- On-board surveys or surveys conducted at busy transit stops
- Type of fare used
- Type of service used
- Pick-up or drop-off location
- Customer demographic information.
Surveys
Surveys conducted on-board transit vehicles or at major transit stops can ask questions about riders’ trip purpose. This data can then be cross- tabbed with other information gathered in the survey, including the riders’ age, employment status, disability status, or other demographic information. This cross-tabulation can help transit planners better understand their customers’ needs so services can be tailored better to their needs.

Fare Type
Most agencies have multiple fare types that can offer clues as to customers’ trip purposes. Specific fare types may only be eligible for certain trip purposes or may only be available to certain populations who typically have only a few common trip purposes. Fare options may include:
- Half-fares: most agencies offer half fares to seniors and persons with disabilities. Seniors are typically retired and not attending school, so it can be assumed that they are riding to access retail, medical, or social services.
- Medicaid: these trip purposes are required to be medical by law.
- Fare Zones: many agencies have fare zones where passengers pay higher fares for longer travel within the system. Where fare zones contain only one major destination (e.g.., a rural hospital), it can be assumed that trips are medical or, if during peak shift change times, trips to and from work.
- School Passes: school pass passengers can generally only use their passes to ride to and from school.
- Employer Passes: employer passes used during peak periods or shift change times can be assumed to be to and from work.
Type of Service Used
There are numerous ways to infer customers’ trip purposes based on the type of service they are riding.
- Peak period commuter service: riders using more expensive express services are more likely to commute for work.
- School tripper service: riders using trips designed for school service are likely going to and from home and school.
- Demand-response Medicare or Medicaid service: riders using these services are likely traveling to and from medical appointments.
- Evening or weekend service to specific destinations: riders using these services are likely essential or service workers, particularly on smaller systems. Riders could also be attending events or accessing retail or entertainment.
Customer Demographic Information
Customer demographic information can offer clues to their trip purpose. For example, most seniors are retired and use transit instead to access medical care, senior services, or retail. Middle and high school- aged youths typically use transit to get to and from school. Using survey information, agencies can create simple correlations between demographic information and trip purpose to build simple spreadsheet models that can help define trip purpose based on this information.
Providing Access for Different Trip Purposes
Different trip purposes require different types of service, and it is important for transit agencies to understand the different types of locations customers in their service area are trying to access.
- Peak period commuter service is often needed to provide access to jobs on the traditional “9 to 5” schedule. These types of services are typically oriented in a single direction during each peak period.
- Commuter trips for second and third-shift essential and service workers typically take place during the PM peak, evening, or late-night periods and also on weekends; therefore, peak period only service is not adequate for these workers.
- Medical and social service trips typically require service between 8 a.m. and 5 p.m. on weekdays when these services are open for business; therefore, peak period only service is not adequate for these purposes.
- Shopping trips typically take place during off-peak times, PM peak times, or on weekends and therefore require service during these times.
There are a number of other important destinations for vulnerable populations, particularly those with limited English proficiency and low incomes. These destinations are often governmental buildings, language services organizations, or community colleges. Transit agencies should work with their local partners to identify where these services are located and what their hours of operation are to ensure that they are properly served. Often, providing service to these types of destinations during off-peak times creates inefficient routes, and that is often expected; these types of “lifeline” routes are important to ensure vulnerable populations have access to the services they need.
Trip Planning Accessibility
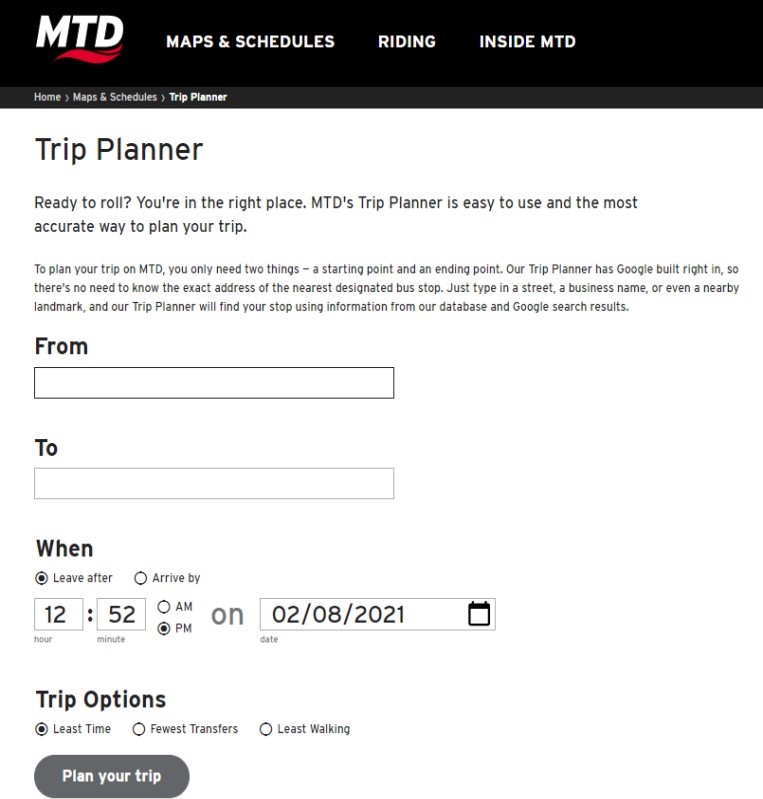
Transit agencies often provide information about their services through schedule brochures that show the route pattern and scheduled arrivals at each timepoint. While this is helpful information, it requires that the user understands how to extract the information that they need from the schedule. Providing data for trip planners can make understanding the service and planning a trip much easier for a rider.
Trip planners allow users to enter a starting location and destination, and the trip planner will find the best way to make the trip using transit services.
The trip planner may also offer additional options, such as : choosing a date or timeframe for the trip, which is important if service is substantially different in peak versus off-peak periods; choosing travel preferences, like minimizing transfers or reducing walking distance; and choosing street addresses rather than existing stops, which is helpful if the user does not know where the nearest bus stop is located.
An agency can produce a GTFS feed that can be published online for use in existing trip planners. Alternatively, an agency can build and host its own trip planner on its website. Either way, providing schedule data to a trip planner increases riders’ ability to understand and use the service.
Trip planners work from GTFS schedule data, but providing real-time data can also be valuable information for riders. Real-time data can estimate when a vehicle will arrive based on the actual vehicle location, which provides riders more realistic information about their trip. Real-time data generally comes from automatic vehicle location (AVL) data.
Real-Time Signs in Victor Valley
Victor Valley Transit Authority (VVTA) is a rural transit provider with a service area of 425 square miles in California.68 Their large service makes providing accurate information difficult, but they implemented real-time signage at a major transfer point in Apple Valley using solar power and existing CAD and AVL data. The new sign provides valuable real-time information to riders, improving the rider experience and making it easier to use the service.
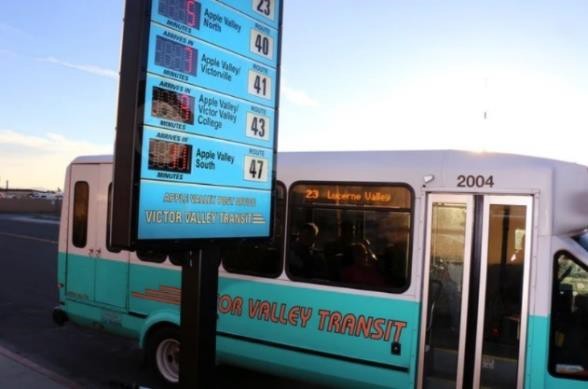
68 Victor Valley Transit Authority. 2015. “VVTA Tests Real-Time Transit Sign in Apple Valley.” Mass Transit Magazine. View the reference website here (external link)
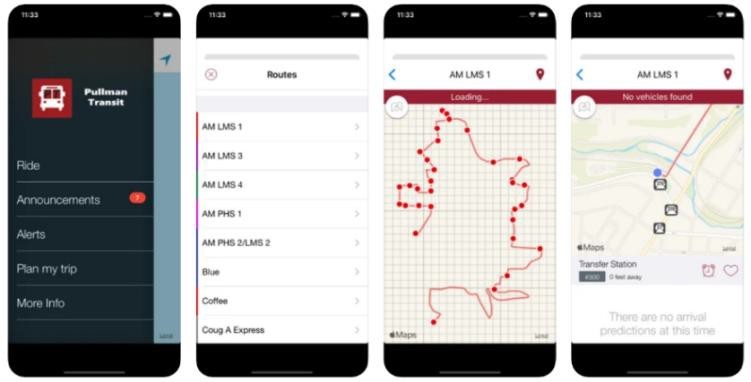
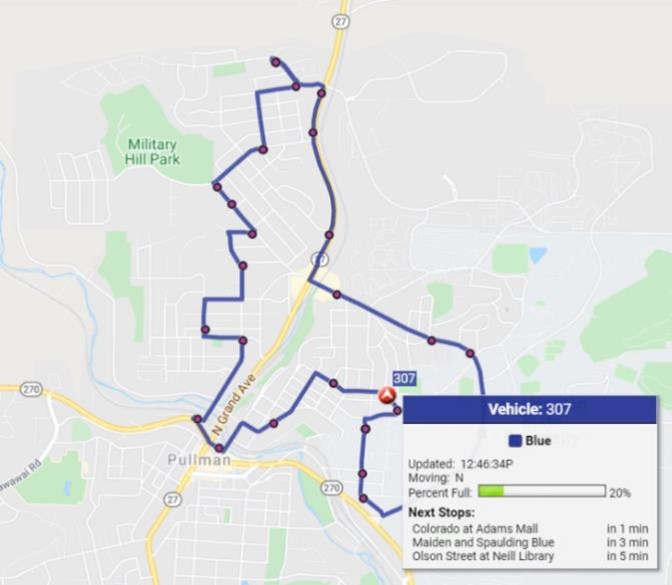
Agency Profile: Pullman Transit Mobile App
Pullman transit implemented a new mobile app that provides users with a trip planner, vehicle locations, estimated arrival times, passenger loads, and the ability to provide feedback to the agency.
Context
Pullman Transit, located in eastern Washington, deployed a new mobile app in 2019 when it updated its AVL system. The agency operates fixed-route services in the city of Pullman, which is home to Washington State University (WSU), a PAC-12 school. Most routes connect to major destinations on campus and also to off-campus student apartments. Over 75 percent of riders on the system are WSU students, so Pullman operates a reduced “community service” schedule when classes at WSU are not in session. The agency also operates school services for the city’s middle and high schools.
When it came time to procure a new AVL system, Pullman Transit issued a request for proposals (RFP) for one that would include a mobile app as part of its system. They eventually procured a system from GMV Syncromatics. The mobile app has many capabilities, including real-time vehicle tracking, passenger load tracking, a trip planner, automated announcements, and the ability to receive feedback. The passenger load tracking is critical to riders, as buses often experience overcrowding on certain trips just before class start times, leading to “pass-bys.” The feedback Pullman receives from riders through the app is also important as it helps identify real-time issues. The Syncromatics suite also includes a program called Transitcheck, which allows drivers to do their pre-trip and post-trip maintenance checks digitally.
Resources Needed
Pullman Transit staff wrote an RFP for a new AVL system and accompanying mobile app in-house and then scored and selected a final vendor. They used 100 percent local funding for this procurement, following city guidelines and procurement requirements. The agency had staff on-site when the systems were being installed to learn about the systems in the process. Because the agency has WiFi in its garage and bus yard, it did not need a cellular package to perform regular software updates.
GMV Syncromatics, the vendor for the AVL system and mobile app, provides troubleshooting guides for common issues and a designated contact for when issues arise. They also provided training for operators shortly after the system was installed. Replacement parts could be sent whenever necessary and installed by Pullman Transit maintenance staff. Updates and upgrades to the system are automatically available to the agency without additional cost. Like most vendors, financing was provided available over a five- to six-year period, so that the agency did not have to find a large funding source in a single fiscal year.
Pullman Transit staff only needed to enter new schedule information to see updates displayed in the mobile app, including the trip planner. The app also is set to update automatically when the agency switches from its Community Plus service to Community Service when WSU isn’t in session.
Results
Pullman Transit tracks the number of mobile app users, which had more than 14,000 in February 2020, the last full pre-COVID 19 pandemic month for which data was available. They also include questions about the app in their onboard survey efforts. Users of the app can send direct feedback through it as well. Overall, agency staff noted that since the implementation of the app, customer service calls have dropped significantly.
Lessons Learned
Pullman Transit staff noted several lessons learned throughout the process of implementing their new AVL system and accompanying mobile app. They include:
- Prior to procuring systems from new vendors, agencies need to research vendors’ customer service ratings or capabilities to ensure that ongoing technical support is offered.
- Planning the installation of new systems can be difficult when your agency does not have many spare vehicles. Systems may need to be installed during off-peak periods.
- It is important to be present when new systems are being installed so that agency maintenance staff can learn as much as possible to troubleshoot issues that may arise in the future. When agencies have several different types of vehicles, installations on each type may differ.
Key Takeaways
In implementing a new AVL system with an accompanying mobile app, Pullman Transit was able to provide better information to its customers.
Ongoing technical support and an understanding of the technology are important in selecting a new system.
More Information
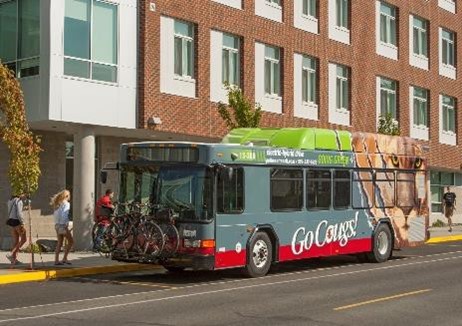
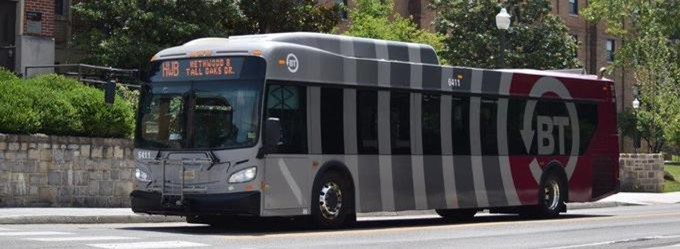
Agency Profile: Blacksburg Transit Mobile App
Blacksburg Transit (BT) implemented a real-time bus location app and live bus map using a partnership with Virginia Tech University.
Context
Blacksburg Transit (BT) provides service in Blacksburg and Christiansburg, VA. Much of the agency’s service is centered on Virginia Tech University, the main employer and economic driver in the area. Because over 90 percent of BT riders are Virginia Tech students or staff, BT operates reduced service when classes are not in session. Service in Christiansburg is more community-oriented, serving major residential developments and employment concentrations.
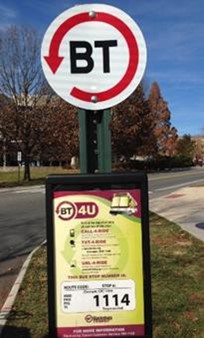
Driven by requests from students for more real-time information, BT first partnered with a computer science program at Virginia Tech to launch a real-time bus location texting service. Users could text a bus stop id to a specified number and receive a text back with the next three bus arrival times at that stop. Each bus stop sign in the system had the bus stop id included on it. Eventually, this service was formalized into an actual mobile app first called “BT4U.” The app added additional capabilities, including live bus maps, a link to the BT website, bus stop information, a trip planner, and a feedback option. In addition to information for passengers, the app also sends the unique ID and app-based data to the content- management software on BT’s server in order to collect a record of passenger behavior. For instance, if a rider looks up a specific route, that event is captured, and if they actually Figure 42: BT Sign with Stop ID complete that trip, that event is also collected. Subsequent upgrades to the app-enabled riders to see bus passenger loads on active vehicles – adding further trip planning capabilities. With these updates, the app was also renamed the “BT App.”
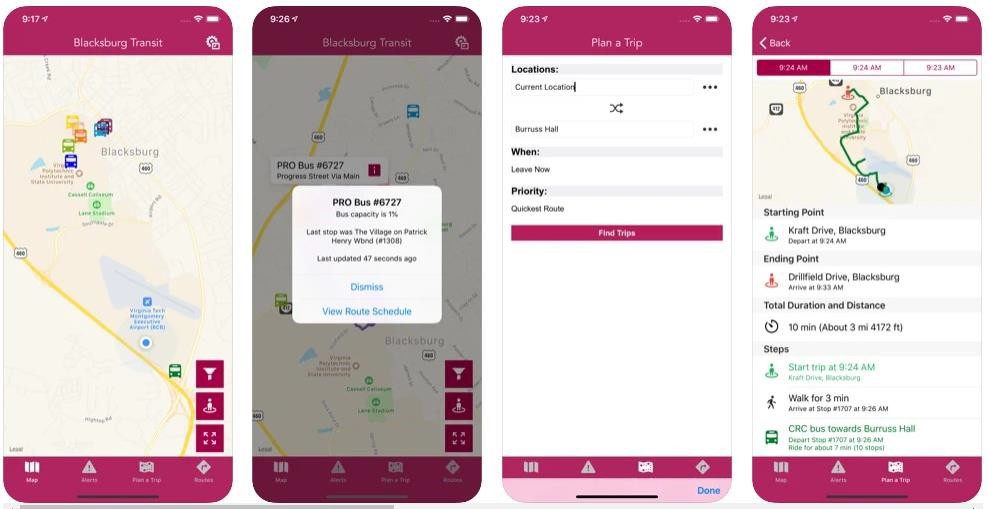
The latest version of the BT App has a number of new features, including:
- See stop(s) closest to the user’s current location on a live map
- Select a route by clicking on a bus on the live map
- Select a stop to view all routes serving that specific stop, including departure information
- Plan a trip by a preference of quickest route, fewest transfers, or least amount of walking
- View all active BT alerts regarding detours, route changes, and emergency information
- View departure times for an entire day by stop
Resources Needed
The major resources that were required to develop BT’s real-time information services were the AVL/GPS and APC systems installed on vehicles, internal information technology staff, and the partnership with Virginia Tech. BT’s partnership with Virginia Tech’s computer science program required extensive knowledge of not only the AVL technology used by the agency but also of programming in general.
Without this internal knowledge, BT would have needed to hire an outside consultant or worked with an organization like Code for America to help build all stages of the app. Additionally, staff knowledge needs to include the ability to update and maintain the app, particularly when smartphone manufacturers like Apple or Android make changes to their platforms. Having the ability to store data in the cloud is also important to ensure that data and code are always backed up, and cloud- computing is enabled to speed up the data processing time.
Results
The BT App drastically improved BT’s ability to disseminate information to riders and improve its customer service.
- The number of customer service calls was significantly reduced once the app was launched.
- While the majority of BT riders are affiliated with Virginia Tech, the app can also be used for the agency’s routes that are focused on Christiansburg, benefiting local riders in this area.
- The inclusion of passenger loads in the app has helped reduce BT’s “pass-by” issue (when full buses lead to customers being left at stops), as it allows customers to see in advance when buses are full and alter their trip plans.
- Feedback received through the app has led to its continued improvement, including several improvements to the trip planning component.
Lessons Learned
BT learned important lessons when deploying the various iterations of its real-time notification system and mobile app, including:
- When partnering with universities, it is important to account for the differences in expected project timelines between the agency and the university. University students may only have a semester or two to devote to a specific project, whereas technology procurements and planning staff resources at agencies can take two to three years. Setting expectations and allowing for continuing the partnership through agency internships or through specific professors is vital.
- Before deploying new technology, it is important to first define what problem or issue you are hoping to solve with it. Too often, agencies see new tools or technology that they find interesting and procure it before really knowing how it will help them solve problems. In BT’s case, the issue was first identified as customers not having real-time information about bus arrivals, leading to frustration when waiting at bus stops.
Key Takeaways
- Agencies providing service in university towns can form beneficial partnerships with university programs to develop new technologies, including mobile apps.
- Mobile apps that include real-time bus locations and passenger loads let customers plan for potential disruptions to their planned trips – particularly when trip planners are also included in the same app.
- In addition to the hardware needed on-board vehicles and a partner with the capability to build a mobile app, staff knowledge at the agency is key to ensuring that mobile apps are sustainable and able to be continually updated through service changes and mobile app vendor updates.
More Information
Conclusion
Considering issues of access and equity can help a transit agency more thoroughly understand the diversity of its riders and their needs. Conducting accessibility analyses to understand the destinations and jobs accessible by public transit is becoming more widespread as agencies seek to understand how a rider can use their services. Equity and accessibility are intrinsically linked, as differences in transit accessibility between different groups raise issues with equity. Although equity considerations are required by Title VI, there are opportunities to conduct a more thorough analysis. This can include detailed service equity analysis, understanding different customer characteristics and how they relate to the transit services they use, and understanding the range of trip purposes customers use transit for.
Collecting and analyzing accessibility, fare, demographic, and trip purpose data enables transit agencies to consider access and equity more thoroughly.
Checklist: What types of equity and accessibility analyses does your agency already conduct, and what types would you like to explore further?
| Analysis | Will Help Determine… | Have Conducted This Analysis | Want to Use This Analysis |
| Service Equity Analysis | …if service changes harm minority or low-income populations. | ||
| Accessibility Analysis | …what areas a rider can reach on public transit in a limited amount of time. | ||
| Fare Equity Analysis | …if fare changes result in a disparate impact on minority or low-income populations. | ||
| Customer Profiles | …if routes or fare media are critical to high-need groups. | ||
| Trip Purpose Analysis | …if there are unmet needs for particular demographics | ||
| Trip Planning Accessibility | …if trip planning is accessible to riders. |