In the field of transportation planning, dashboards serve as vital tools for leveraging transit data effectively. These visual interfaces offer insights into various aspects of transit operations and performance. Dashboards enable transportation planners to analyze ridership trends, track service reliability, and monitor key performance indicators. By providing a centralized platform for data visualization, dashboards facilitate informed decision-making processes, allowing planners to optimize service planning, allocate resources efficiently, and enhance overall transit system functionality.
As dashboard uses are becoming more widespread across transit agencies, the National Center for Applied Transit Technology (N-CATT) aims to provide small-urban, rural, and tribal transit providers with the basic skills to create dashboards from the data they track. This workshop will be broken into three sessions of approximately two and a half hours, including: Dashboard Basics, From Data to Dashboard, and Styling and Advanced Dashboard Concepts.
In this workshop, attendees will learn about the basics of data cleaning and visualization, transforming data to interactive visualizations using Power BI, and leveraging advanced Power BI functionality to enhance dashboard operations and user experience. After attending all three sessions, attendees should be equipped to either begin or expand their use of dashboards to better inform decisions and monitor implementation progress.
Related:
How to Build a Data Dashboard Free On-Demand Course
Using the techniques from this workshop, transit managers can make informed decisions to plan for the future of their agency,…

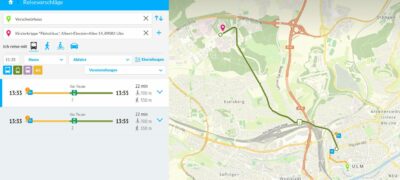
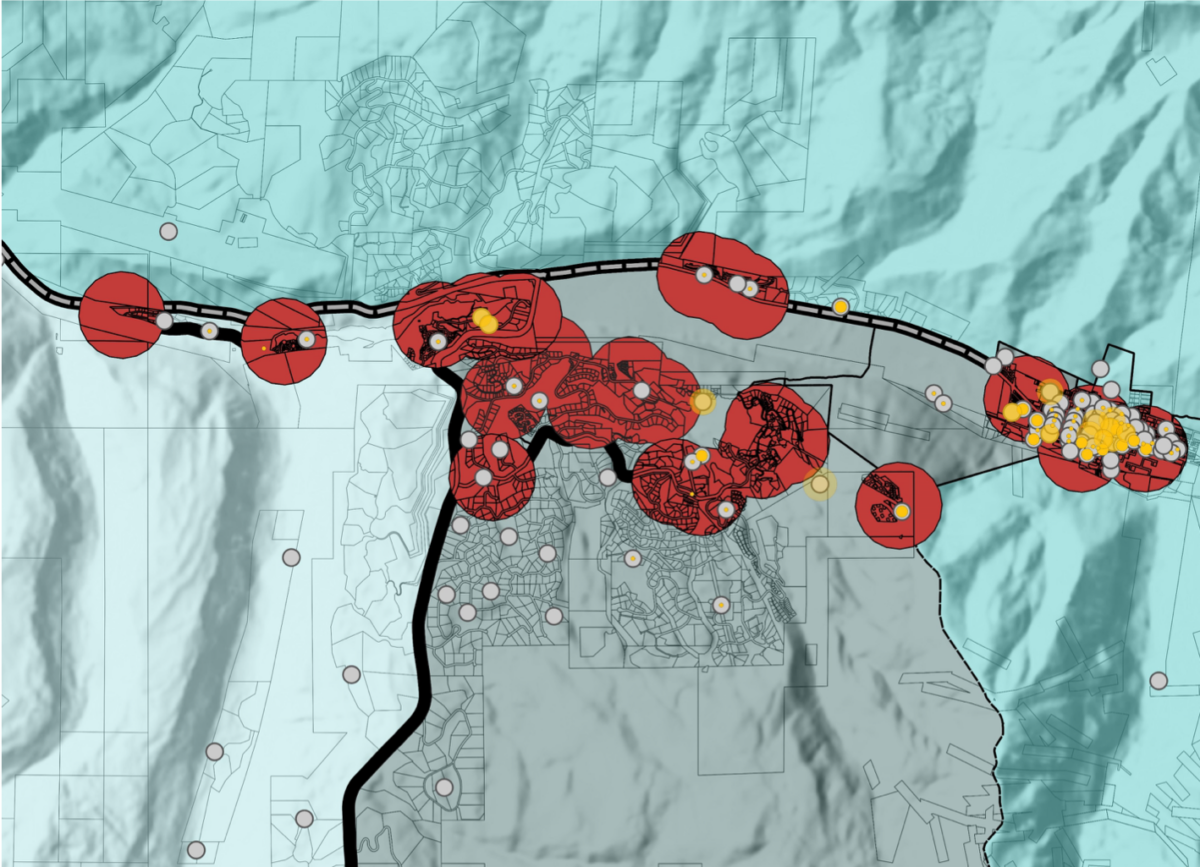
GIS 201: Using GIS for Transit Planning Free On-Demand Course
This hands-on workshop is geared toward transit agency staff who want to use GIS for analysis or map-making but may…


One on One Technical Assistance with Experts!
N-CATT has an exciting new Technical Assistance offering! From now through September 1st you can get one-on-one technical assistance from…