A Guide to Green Energy Adoption for Transit Agencies Chapter 2: Green Energy Infrastructure
- Date: February 13, 2022
Jump to section
Transit agencies across the United States are exploring opportunities to install on-site green energy infrastructure. Transit agencies can utilize on-site green energy to support fueling infrastructure for a zero-emission bus (ZEB) deployment, offset energy use from the grid across its facilities, and pair with battery storage systems.
The cost of the most prevalent green energy resources, wind and solar, have decreased to the point that they are both among the most cost-competitive sources of energy to build. According to the Institute for Local Self-Reliance, a nonprofit research and educational organization, green energy made up the majority of the United States’ new power generation capacity in the third quarter of 2020 (McCoy, 2020). This was the fifth quarter in a row, and ninth in the last twelve, in which the majority of the United States new power generation capacity consisted of green energy.
A transit agency’s decision to pursue green energy is influenced by a number of factors, including:
- Agency electricity costs
- Available funding and/or credits for green energy
- Agency, city, or state GHG emission reduction goals and/or laws
- Available space for the infrastructure
- Availability and accessibility of renewable resources at the property
- Overall project costs
If a transit agency does decide to pursue the procurement of a green energy system, it is important to understand both the physical footprint and expected costs of the system. This chapter provides information as a starting point for agencies both actively considering or in the early stages of learning about green energy.
Sizing Energy Infrastructure: Utility-Scale vs. On-Site Generation
While transit agencies can produce energy on-site to support ZEB deployments or facility energy needs, transitioning 100% of operations to green energy may require utility-scale generation. The definition of “utility-scale” depends on the source of the energy generation and the entity defining the project. The Department of Energy defines utility scale as projects 10 megawatts (MW) or larger. Utility-scale solar facilities are defined by the US Energy Information System as being 1 MW or greater—such a facility would power approximately 197 homes per year. According to the Solar Energy Industries Associate (SEIA), 1 MW of solar generation capacity requires five to ten acres (SEIA). While some transit facilities may have enough rooftop space to facilitate a utility-scale solar installation, space limitations may prevent other agencies from building a system of this size.
Utility-scale wind turbines are defined by the Department of Energy as turbines greater than 100 kilowatts (kW) in size, which is large enough to power about 27 homes per year. While there are wind energy projects that fall under the threshold of utility-scale, the installed cost per kW of a small turbine is more than seven times the cost of utility-scale wind projects (Center for Sustainable Systems, 2020).
Alternatively, the cost gap between large-scale and small-scale solar energy systems is not nearly as large. Cost decreases of nearly 89% since 2009 have allowed homeowners and businesses to purchase an affordable, reliable way to produce energy on-site, while lowering energy costs and emissions impacts for their operations and buildings (Center for Sustainable Systems, 2020). As of November 2018, solar energy installations of less than 1 MW capacity made up nearly 40% of total solar capacity connected to the electricity grid in the United States (U.S. Energy Information Administration, 2019).
For transit agencies unable to host on-site green energy or interested in purchasing more green energy than on-site generation could produce, Chapter 4: Procurement Options for Green Energy opportunities to purchase green energy from utilities and third-party energy developers.
Green Energy Resources and Associated Infrastructure
Solar
Solar photovoltaic (PV) energy systems are the most common solar power technology. These systems are comprised of the following components:
- Semiconductor material: Used to facilitate movement of electrons, freed by energy from the sun, to drive an electrical circuit as a direct current. This material is formed into solar cells which are then connected to form a single solar panel.
- Glass covering or weather-proof material.
- Inverter: Converts direct-current (DC) electricity generated by the solar panel into alternating-current (AC) electricity, which is used by the electrical grid.
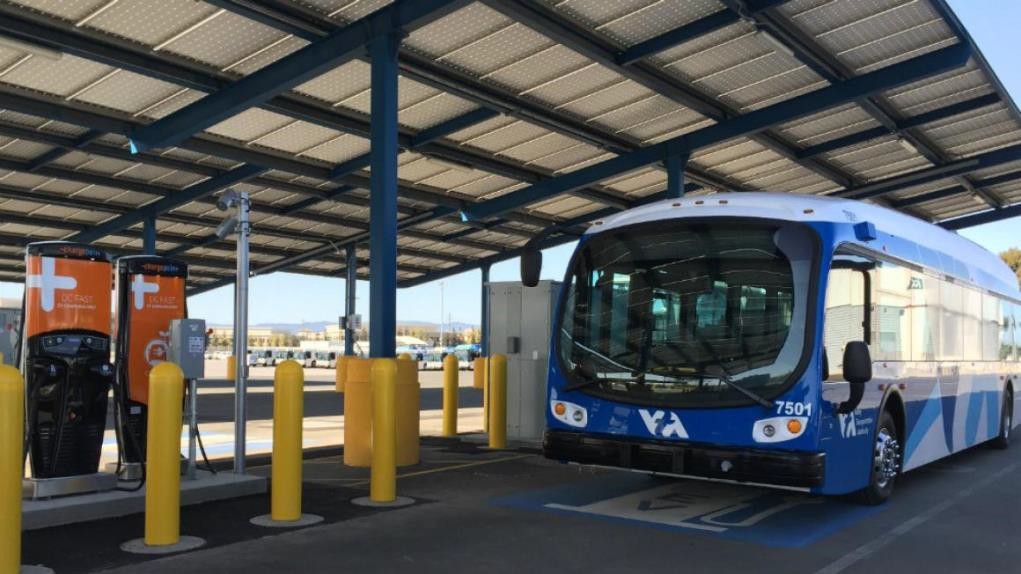
Solar PV systems can be roof or ground mounted, while some facilities incorporate solar panels into the design of carport shading structures. Solar PV systems can be outfitted with a number of different types of inverters. The two primary types are string inverters and microinverters.
String Inverters
String inverters connect a set of panels to a single inverter, which then converts the electricity produced by those panels, the “string”, to AC electricity. Smaller systems can be supported by a single inverter while larger systems will require multiple string inverters. String inverters provide a cost-effective solution for moving electricity from the solar array to the electrical grid. Wiring multiple panels to a single inverter also allows for easier system maintenance as it minimizes potential failure points and limits the components to examine in the event of a system failure.
However, there are tradeoffs to the upfront savings presented by string inverters. String inverters typically come with a standard warranty period of eight to twelve years whereas microinverters are typically warrantied for up to 25 years. And because the individual solar panels are connected as a single series, decreased production from a single panel—whether from shading or dirt or defective cells—leads to decreased production for the whole string of panels.
Microinverters
Microinverters are smaller inverters that connect to every individual solar panel. This means that, unlike a system utilizing string inverters, shading and/or damage to one individual panel will not impact the energy that can be generated by the rest of the system. It also means that transit agencies are able to track individual panel production over time. This can allow an agency to identify defective panels or panels with consistently low production levels.
However, because a microinverter is needed for every panel, costs rise as the size of the installation rises. And although costs have come down, microinverters are typically more expensive than string inverters. Microinverters, because they are attached to each solar panel, increase the amount of equipment on a rooftop and require more involved maintenance than a string inverter.
Table 2: Solar Power Projects at Transit Agencies – Example Projects
| Transit Agency | Installation Year | Solar Installation Size | Cost | Funding Source |
| Indianapolis Public Transportation Corporation | 2016 | 1 MW | $2,200,000 | Federal (80% total project cost) |
| Metro Transit (Minneapolis-St. Paul, MN) | 2015 | 40 kW | $130,000 | Local utility (45% total project cost) |
| Valley Metro (Phoenix, AZ) | 2014 | 780 kW | $2,875,000 | Federal (~95% total project cost) |
| AC Transit (San Francisco, CA) | 2014 | 425 kW | Unknown | Federal |
Wind
Small-scale wind energy systems, while not as common as utility-scale projects, are utilized in some locations with above average wind resources and that have ample space to site equipment. However, in addition to higher project costs (about four times greater cost per kilowatt-hour than commercial solar), wind energy systems can face obstacles to successfully zoning and permitting the project. While no jurisdiction is exactly the same, most zoning ordinances have a height limit of 35 feet. Utility scale wind energy systems can provide low electricity costs, especially during overnight periods when buses may be charging. Chapter 4 of the guidebook includes more information on additional procurement methods for off-site green energy.
Additional Resource: Small Wind Guidebook – Department of Energy
Biomass
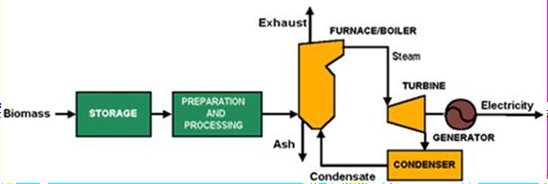
Biomass energy systems are another potential source of on-site green energy production. Biomass is a physical material burned in a boiler. The heat generated from this process drives a steam turbine, which produces electricity. Potential reliable sources of biomass include the forest or agriculture sector, whose stream of waste products can provide a suitable fuel source. Biomass projects are best positioned in areas with consistent, readily available sources of biomass. Transit agencies located near an abundant source of biomass may find themselves well positioned to take advantage of a biomass project.
Biomass electric generation systems generally consist of some combination of the following items:
- Primary Items:
- Fuel storage and handling equipment
- Combustor/furnace
- Boiler
- Steam turbine
- Generator
- Exhaust/emissions controls
- System controls
- Other Items:
- Pumps
- Fans
- Condenser
- Cooling tower
Deploying biomass energy systems at a small-scale can present challenges. The National Institute for Building Sciences found that the installation cost of small-scale biomass ranges from $3,000-$4,000 per kW, which is about twice the installed cost of on-site solar. This cost does not factor in the cost of delivering the biomass itself to the facility. Not all areas of the country have easily accessible sources of biomass, and the ongoing cost of fuel and staff support to keep the system operational are an important consideration to the overall project cost. The amount of space required to dedicate to the system can also be a limiting factor, as both on-site storage and access to the fuel source are needed.
In addition to these challenges, different states have different definitions of what qualifies as “green” or “carbon-free” sources of energy. It is important to determine whether the city or state in which an agency operates includes biomass among the list of approved green energy sources.
Additional Resource: State Renewable Portfolio Standards and Goals – National Conference of State Legislatures
Energy Storage
Transit agencies have used energy storage technologies to support operations in case of an unexpected power outage. However, the technology most often used to facilitate backup power has traditionally been a generator and the energy source has been liquid fuel, like diesel. Green energy storage technologies operate on the same principle of storing energy now to use in times of greater need. The primary green energy technologies being deployed to serve this function come in the form of batteries and electricity or hydrogen paired with electrolyzers and fuel cells.
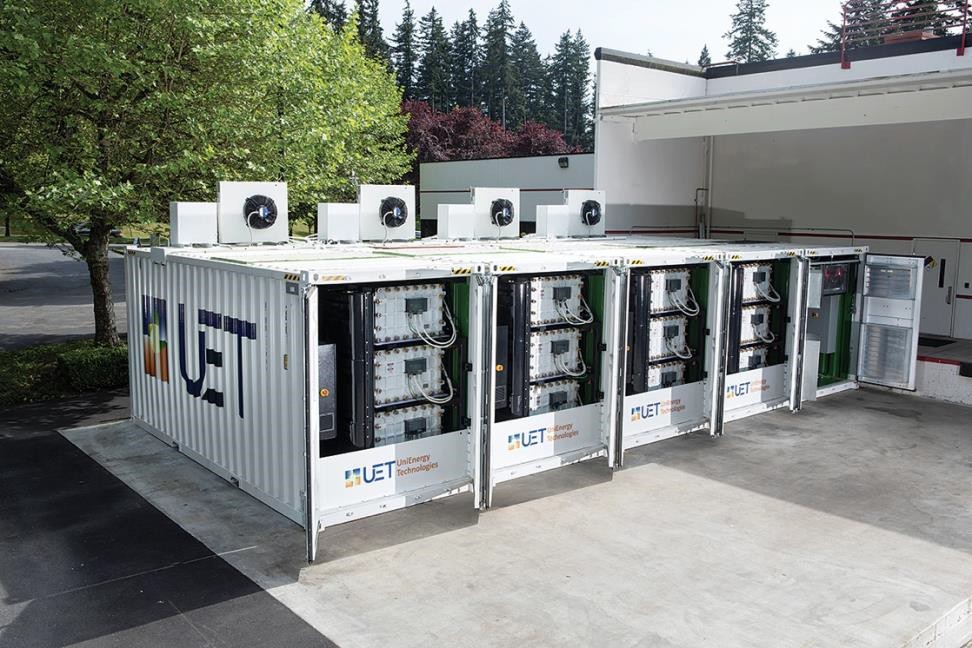
Lithium-Ion Batteries
Lithium-ion batteries are the most widely deployed form of large-scale battery storage in the world, making up more than 90% of the market. Traditionally used in smaller products like cell phones and power tools, these batteries can achieve efficiency levels of up to 95% and have expected useful lifespans of 10-15 years. Lithium-ion batteries from electric vehicles are even being used beyond their initial useful life in stationary energy storage applications, as detailed in a 2020 whitepaper from the University of California-Davis and the Union of Concerned Scientists (Ambrose, Kendall, Slattery, & Steckel, 2020). The cost per kilowatt-hour (kWh) of lithium-ion batteries has decreased significantly in the past decade. Bloomberg New Energy
Finance, an energy research organization, found that lithium-ion battery pack prices dropped by from $1,100 per kWh in 2010 to $137 per kWh in 2020 (BNEF, 2020).
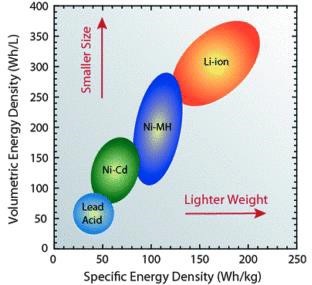
Lithium-ion batteries are also valued because of their energy storage density, or ability to hold greater amounts of energy within less physical space. According to Sage Energy Consulting, an independent renewable energy consulting firm, a 1-megawatt-hour (MWh) battery system has roughly the same physical footprint as one parking space.
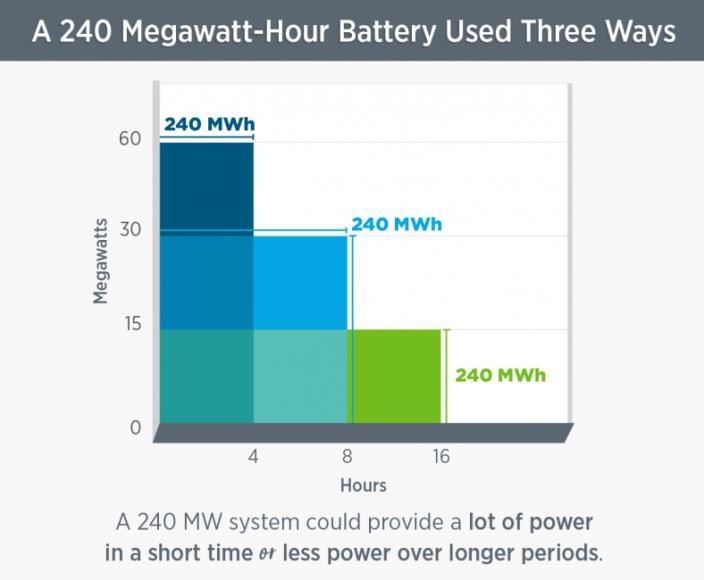
Battery energy storage systems typically come attached with two numbers – the power rating (watts) and amount of available energy storage (watt-hours). For example, a battery may have a 500-kW power rating and 2 MWh (2,000 kWh) of available storage. If operating at full capacity, this battery could supply four hours of energy for up to 500 kW of demand (2,000 kWh/500 kW = 4 hours). This is typically what is meant when a battery storage system is referred to as an “X- hour” battery. However, battery storage systems do not have to operate at full capacity. The graph below shows some of the ways in which the energy stored in a battery can be discharged for use.
Battery energy storage systems typically come attached with two numbers – the power rating (watts) and amount of available energy storage (watt-hours). For example, a battery may have a 500-kW power rating and 2 MWh (2,000 kWh) of available storage. If operating at full capacity, this battery could supply four hours of energy for up to 500 kW of demand (2,000 kWh/500 kW = 4 hours). This is typically what is meant when a battery storage system is referred to as an “X- hour” battery. However, battery storage systems do not have to operate at full capacity. The graph below shows some of the ways in which the energy stored in a battery can be discharged for use.
Hydrogen
Although more commonly known for its applications in vehicle technology, hydrogen can also serve as a stationary energy storage system mechanism. When used in combination with fuel cells and green energy sources, hydrogen can be produced with a zero-emission energy cycle. While less energy efficient than lithium-ion batteries, hydrogen fuel cells can discharge energy over longer periods of time. Power Innovations, a provider of hydrogen fuel cell technologies, successfully provided 48 continuous hours of power for a data center with 250 kW of demand (Bailey, 2020). This demonstration followed up on a pilot program in partnership with NREL, which operated a single server rack at an on-site data center.
Table 3: Energy Storage System Characteristics
| Max Power Rating (MW) | Typical Discharge Time | Max cycles or lifetime | Energy Density (watt-hour per liter) | Efficiency (%) | |
| Pumped hydro | 3,000 | 4h – 16h | 30 – 60 years | 0.2 – 2 | 70 – 85 |
| Compressed Air | 1,000 | 2h – 30h | 20 – 40 years | 2 – 6 | 40 – 70 |
| Molten Salt (thermal) | 150 | hours | 30 years | 70 – 210 | 80 – 90 |
| Li-ion battery | 100 | 1 min – 8h | 1,000 – 10,000 | 200 – 400 | 85 – 95 |
| Lead-acid battery | 100 | 1 min – 8h | 6 – 40 years | 50 – 80 | 80 – 90 |
| Flow Battery | 100 | hours | 12,000 – 14,000 | 20 – 70 | 60 – 85 |
| Hydrogen | 100 | mins – week | 5 – 30 years | 600 (at 200 bar) | 25 – 45 |
| Flywheel | 20 | secs – mins | 20,000 – 100,000 | 20 – 80 | 70 – 95 |
While the cost of hydrogen, fuel cells, and the accompanying infrastructure has continued to decrease, they are not yet cost-competitive with lithium-ion batteries. Hydrogen fuel cells also require equipment, and physical space, for on-site production and/or storage of green hydrogen. For agencies already deploying fuel-cell electric buses (FCEB), additional buildout of stationary storage could be incorporated into existing infrastructure.
Flow Batteries
Flow batteries comprise roughly five percent of the energy storage market. They serve as the primary alternative to lithium-ion batteries, and have longer expected lifespans. Flow batteries can also be scaled to service larger energy consumption needs.
Unlike lithium-ion batteries, flow batteries store energy in liquid form. These liquids are stored in two separate tanks, which can be scaled to meet the needs of the storage project. While project costs have decreased and are projected to continue, a 2019 report by the Department of Energy found that total project cost for lithium-ion batteries was a little more than half that of flow batteries on a per kWh basis (Mongird, et al., 2019).
Connecting Green Energy Infrastructure to Zero-Emission Bus (ZEB) Fueling Infrastructure
For agencies operating ZEBs, building on-site green energy can provide additional opportunities to decrease the costs and greenhouse gas (GHG) emissions associated with vehicle fueling.
Whether it is charging infrastructure for battery electric buses (BEB) or green hydrogen fueling infrastructure for FCEBs, pairing on-site solar PV or energy storage with vehicle fueling could potentially add value to both projects. Agencies should coordinate with their utility early in the project development process to understand whether utility infrastructure upgrades are necessary to pairing on-site energy generation and energy storage with fueling infrastructure. If it is possible, the agency should then explore whether such a project might require any utility infrastructure upgrades and how utility rate structures may be impacted.