Data Practices Chapter 1 – Data Sources
- Date: February 2, 2022
Jump to section
Good data allows for good decision-making, and understanding your agency’s data sources is the first step to collecting, storing, and analyzing data. Data sources can range from manual sources recorded with pen and paper to electronic sources recorded with mobile devices to passive sources that are automatically collected using installed hardware and connected technologies. In the digital age, new data sources including location-based services data are increasingly available to agencies. This fact sheet provides an overview of transit data sources that could be useful to small agencies and allow you to unlock insights into your customers’ behavior, your system’s performance, and market demand in your service area.
Transit data sources can be manua l or passive, meaning they can be collected manually or automatically using on-board techno logies
Manual Data Sources
Ridechecks
Ridership can be estimated through methods such as a ridecheck. Ridechecks are performed by staff that count activity at each stop on sampled trips. These sampled trips can then be used to estimate overall ridership for the system or, with a large enough sample, specific routes, months, or times of the day.
Trip Requests and Trip Logs
For demand response services, trip requests and trip logs are a valuable source of data. Trip requests are documented by dispatch, including the origin, destination, desired timing for the trip, and the number of passengers. Trip logs can then provide agencies with important information about the level of demand for their service.
Asset Management and Maintenance Data
For small agencies, transit asset management (TAM) data collection is necessary for state reporting. The foundation for a TAM plan is an asset inventory, which catalogs the rolling stock, service vehicles, and facilities operated by an agency. The condition of each of these assets must be assessed to determine whether the asset is in a State of Good Repair (SGR).
Safety Incident Reports
In the case of a safety incident, many agencies file a report or obtain copies of police reports. As defined by NTD, safety incidents include injuries, fatalities, collisions, significant property damage, and a transit vehicle or facility’s evacuation. As a data source, detailed safety incident reports allow agencies to identify risks or patterns that can be addressed to improve their transit service’s safety.
Customer Service Complaints
Customer feedback via phone calls, texts, emails, mobile applications, or online forms can help agencies bridge the gap between the rider and decision-making staff. To observe trends and track customer satisfaction over time, agencies may record the complaints they receive in a spreadsheet or database to enable comparison and aggregation.
On- Board Customer Surveys
In a customer survey, agencies engage with their customers on board vehicles or at transit stops to learn more about their age, income, trip purpose, or even their origins and destinations. Getting an adequate sample size so statistics are relevant to the entire system is key to an informative survey.
Passive Data Sources
Automatic Passenger Counting (APC)
APC devices measure boardings and alightings at the door of a transit vehicle. As a passive data source, APCs collect data at each stop a vehicle makes, providing agencies with more complete ridership data.
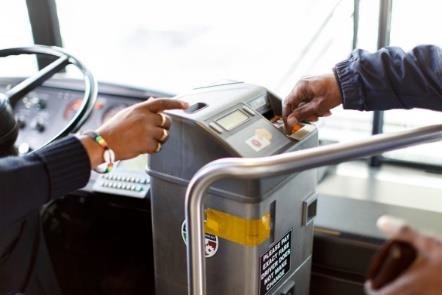
Automatic Fare Collection (AFC)
AFC systems are electronic fare systems that often include fareboxes, fare machines, and customer-facing websites and mobile applications that allow for fare transactions.
With an AFC fare system, passengers can pay using a smart card, a mobile app, cash, or other smart fare media.
Automatic Vehicle Location ( AVL)
AVL devices use global positioning system (GPS) technology to record the location of a bus, enabling real-time location monitoring as well as subsequent location-related analyses. Together with schedule data, AVL data can be used to evaluate on-time performance.
These findings are from the Data Practices Guidebook. The Guidebook is a resource to assist small urban, rural, and tribal transit agencies in understanding and applying good data practices.
Emerging Advancements
Internet of Things (IoT) Technologies
IoT devices are internet-connected, physical equipment that can relay information about their status or be controlled remotely. Devices are equipped with sensors that relay information about vibrations, pressure, heat, power usage, and other conditions to central servers. These features allow agencies to continuously monitor asset conditions.
Aggregate Cellphone Location Data
Aggregate cellphone location data purchased from vendors that obtain, aggregate, and anonymize Location – Based Services (LBS) data. The resulting datasets can provide agencies with information on origins and destinations in their service areas.
Introduction
For transit agencies, making good use of data begins with identifying, collecting, and storing the data sources your agency may already have—and in some cases, obtaining useful data for planning from external sources. For some agencies, digitizing existing paper records for further analysis and improving digital recordkeeping will be the first objective. Other agencies may be ready to begin installing automatic passenger counters (APC) or making use of emerging data sources like cellphone location data. These new sources provide richer insight for planning and performance management but demand greater resources and expertise from agencies.
This chapter provides a broad overview of the data sources small urban, rural, and tribal agencies can leverage for data practices ranging from data-informed planning to partnerships. As defined here, data sources are those records generated within an agency or proprietary information about travelers purchased from a vendor (open data sources like US Census data will be discussed in Chapter 3). The data sources discussed here may represent safety incident reports, ridecheck data, or other digitized agency records created manually by an individual. For some small urban, rural, and tribal agencies, data sources will also include data created by sensors like automatic passenger counters (APCs) that generate data passively.
The current trend a mong transit agencies i s to make increased use of passive data sources that collect data automa tically but that require more effort to analyze.
For instance, many agencies seek to collect more ridership data by using automatic passenger counter (APC) devices on vehicles. Because this ridership data is not input by a human, these sources may be more accurate, but defects with sensor accuracy may create other problems when working with this data. Understanding your data sources and their shortcomings are essential elements of strong data practices.
Tapping into new data sources—or sticking with familiar ones—is not without tradeoffs. Agencies will need to consider the costs of data storage, purchasing, and especially the staff expertise required to work effectively with more complex data sources. Data sets with customer information, such as on-board surveys and demand-response service records, also raise implications for privacy. Key characteristics of data sources are described below. Differences between manually and passively-collected data according to these characteristics are shown in Table 1.1
- Capital cost: The installation of sensors to collect data passively may require retrofitting your bus fleet, while collecting data manually may require little more than clipboards and a spreadsheet to store the collected data. Because of the frequency and scale with which passive data is collected, it often also requires more sophisticated databases and data feeds that are maintained by a vendor or an IT department staff.
- Marginal cost: Manually collected data requires the effort of staff to collect and input data. Each additional data observation requires a marginal effort that is relatively high and does not decrease with volume. Automatically-generated passive data is cheap—the cost of collecting and storing additional records of data might only be measured in pennies.
- Sample sizes: Drawing conclusions from data requires large enough sample sizes to draw statistically significant conclusions. Because of the high marginal cost of manually collected data, generally only small sample sizes can be obtained. With the volume of data generated passively by sensors, you can obtain larger sample sizes and have more confidence in the conclusions drawn from your data.
- Aggregation: Data practices are put to use for different audiences: a board member looking at monthly trends or an analyst diving into distinctions by route or time of day. Both manual and automatic data collection provide opportunities to collect and report aggregate or disaggregate data.
- Category of Data: When data is collected manually, you have the opportunity to collect qualitative data about your system and passengers that a sensor alone could never detect. For instance, when conducting passenger counts manually, it may be more clear what types of customers—students, older adults, workers—get on and off at particular stops, and field observations may reveal how the system is used in practice. However, qualitative impressions are more subject to human biases and misperceptions.
- Reliability: The human eye can be fallible, such as when passengers are accidentally left uncounted on a ridecheck. It is also difficult to know how the data collected by two different persons may differ. Sensors are not without challenges, such as when automatic passenger counters accidentally count one person as two. Unlike manual data, issues with automatic data sources are more consistent over time and can be corrected prior to analysis. However, it is often difficult to outfit an entire fleet with APCs at once, and therefore getting an adequate sample size on every route can be challenging when only certain vehicles are equipped.
- Coverage: When relying on manually collected data, agencies may find gaps in datasets for periods where data was not collected or aggregated, especially if the demands of staff time to collect data are high. Especially on holidays, early in the day, or late in the evening, additional staff may not be available to conduct data collection. With passively generated data, such constraints on data collection apply less if sensors can be widely installed.
- Availability: In certain cases, automatically-generated passive data can be fed directly into analytical tools for real-time or near real-time answers to questions involving data. With manual data, more intentional efforts to collect and then aggregate data are required, limiting the frequency with which it is available.
This chapter will illustrate these key considerations for both emerging data sources and familiar data sources.
1 Wilson et al. “Public Transportation Systems: Data Collection Techniques and Program Design.” (Lecture Notes, MIT, Spring 2017.) View the reference document here (external link). Accessed January 11, 2021.
| Characteristic | Manual | Passive |
| Capital Cost | Low capital cost | High capital cost |
| Marginal Cost | High marginal cost | Low marginal cost |
| Sample Sizes | Small sample sizes | Large sample sizes |
| Aggregation | Aggregate or disaggregate | Aggregate or disaggregate |
| Category of Data | Qualitative or quantitative | Quantitative |
| Reliability | Unreliable | Errors and biases can be estimated |
| Coverage | Limited spatially and temporally | Ubiquitous |
| Availability | Not immediately available | Available in real-time or quasi-real-time |
State of the Practice
Manual Data Sources
At small transit agencies, many sources of data may be collected manually. For these data sources, the volume of data is typically small, requiring a limited investment of time and personnel to gather data and enter it into a spreadsheet or database.
Manual Data Collection Methods: Analog vs. Digital
Tools for manual data collection fall into two categories: analog and digital. Analog methods, such as paper forms or phone calls with customers, often require data collection and data entry as separate steps, each requiring staff resources. Digital methods, such as online forms, mobile applications, or specialized electronic devices, merge the two steps into one by entering data into a spreadsheet or database as it is collected. Advantages of each type of method are listed below:
Analog Methods
- No new technology required (smaller up-front cost)
- Limited technical skills required.
Digital Methods
- More efficient data entry
- Consistent formatting of data
- Reduced staff needs (smaller long-term cost)
- Partial passive data collection (e.g., timestamp).
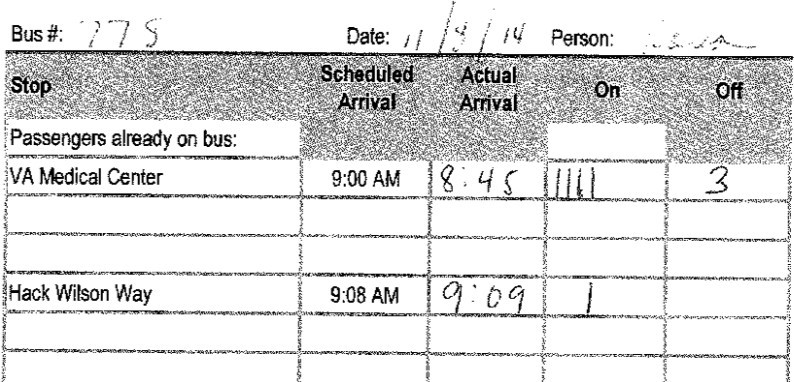
Ridechecks
If passengers are the lifeblood of a transit system, ridership counts are the pulse. For smaller transit agencies, it may be practical to count 100 percent of passengers that board and alight each vehicle. For agencies where a complete count of boardings and alightings at each transit stop cannot practically be obtained, ridership can be estimated through methods such as a ridecheck. Ridechecks are performed by staff that count activity at each stop on sampled trips.2 These sampled trips can then be used to estimate overall ridership for the system or, with a large enough sample, specific routes, months, or times of the day.
Reliability, the ability to disaggregate data, and, most of all, the cost of a ridecheck depend greatly on sample size. Ridechecks conducted for National Transit Database (NTD) ridership reporting must follow a sampling strategy that randomly selects trips, be they an agency’s busiest services, early morning trips, or weekend services.3 When conducting ridechecks for other purposes, the sample size for a ridecheck will vary depending on available resources. Most agencies often aim to sample every trip on every route at least once, obtaining a sample across all days of the week and times of the day. Whatever the approach, known variations in ridership by the time of day, day of the week, and time of year must be considered when developing a ridecheck sampling strategy so that the ridership estimates are not inflated (or underestimated) by the choice of trips to sample.
Most agencies will perform ridechecks to satisfy NTD reporting requirements, which will vary according to the size of the fleet, urbanized area, and counting methods used by an agency. However, ridership data can also be used to perform other analyses, as will be discussed in Chapter Four: Planning and Performance Monitoring. Uses for ridership data may include:
- Measuring the maximum passenger load per trip
- Identifying ridership trends by time of day
- Comparing boardings and alightings along a route to identify stops with the greatest and least ridership.
Ridechecks may be performed using pen-and-paper-based methods or manual entry into a spreadsheet or online form. While riding on a bus route, the observer may be required to manually enter the route, trip, and stop information associated with each recorded observation. Alternatively, this information can be populated prior to sampling using the route’s schedule. In some cases, data collected with an electronic device allows for route, trip, and stop information to be inferred during subsequent analysis based on timestamps and geographic location data associated with each record.
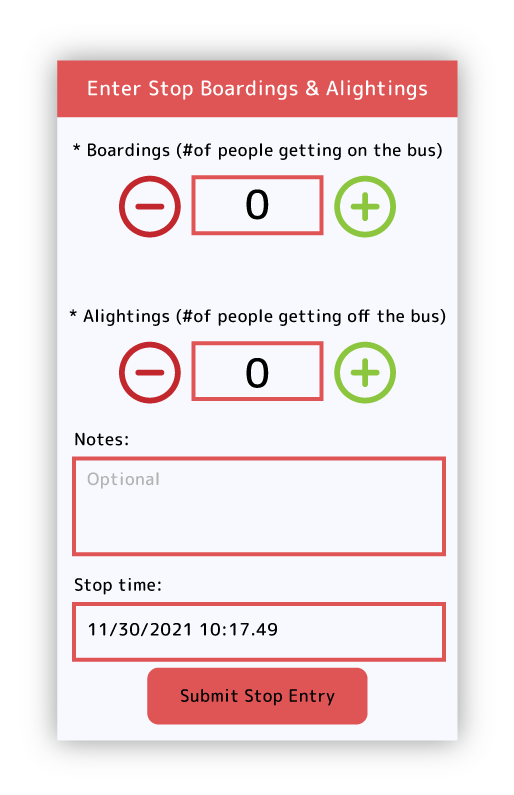
Electronic passenger counters (EPC) offer a manual form of ridership counting with many of the advantages of higher-cost passive data collection devices. With an EPC device, bus drivers press a button on a tablet for every boarding and alighting at each stop. The device can be programmed with the planned schedule, automatically recording the route, trip, and stop for each data point. As an electronic data source, data from EPC devices can be uploaded directly to a database. While the capital cost is greater than pen-and-paper or simpler electronic methods, the marginal cost is reduced by using bus drivers instead of separate staff to perform counts. In addition, the sample size is maximized for full coverage: EPCs enable agencies to measure ridership on every trip. As with all manually collected data, reliability is still low, particularly since drivers must multitask by counting riders while collecting fares and managing passengers. Because of the demands of both manual ridechecks and EPCs, larger agencies may conduct ridership estimates using Automatic Passenger Counters that collect far larger samples.
2 For larger agencies that must report passenger miles traveled (PMT) to the National Transit Database, alightings must also be recorded. These requirements are specified in the NTD Policy Manual for Reduced Reporters.
3 Specific guidance for sample-based NTD ridership reporting is provided in the National Transit Database Sampling Manual. View the manual here (external link)
Trip Requests and Trip Logs
For demand response services, trip request information and trip logs are valuable sources of data. Every trip that is requested and delivered is recorded by demand response dispatchers and drivers, with key data points that may be used to identify key trends in the operation and usage of the service. Common datapoints include the origin, destination, desired timing for the trip, and number of passengers.
Dispatchers may also record the trip purpose and any special requests, such as wheelchair assistance or pickup details. Upon scheduling the trip, data recorded by dispatch may include the assigned vehicle and driver, the pickup window, and estimated trip duration. Independent of trip logs representing actual delivered service, trip requests provide agencies with important information about the level of demand for their service. Insights into who wishes to use the service, where riders live, when they make trips, and common destinations assist operators when scheduling drivers to meet capacity. Planners can also utilize this data when determining the service area, fares, or other service policies. Additional data, such as the reason for a declined trip request, may highlight the limitations of the demand response service.

Trip logs are usually documented by drivers, who record information such as the number of riders, fare payment, time, date, and trip information, including distance and duration. The time and distance traveled in non-revenue service are also an important part of a trip log. In contrast with trip request data, trip logs represent the actual service as delivered. For both internal and mandatory reporting applications, trip log data provides actual ridership, revenue and non-revenue hours and miles, and fare revenue information by trip that may be aggregated to calculate total ridership and total service delivered. In addition to aggregate metrics, agencies can use this data to analyze productivity metrics such as revenue miles per passenger and variable operating costs, including cost per passenger and cost per revenue hour. Beyond reporting requirements, agencies may record and analyze supplemental information on trip logs such as wait times, origin, destination, trip purpose, and other details such as wheelchair ramp usage.
Some of the richest insights from trip request data and trip logs can result from comparing the two datasets. In order to facilitate comparison, the datasets should use similar formats and a common identifier for trips. By comparing scheduled and actual pick up and drop off times, planners can measure on-time performance, the accuracy of trip duration estimates, average wait times. Such evaluations help agencies to identify opportunities for operational efficiency and to fine-tune policies to benefit riders and increase service quality.
Asset Management and Maintenance Data
“State of Good Repair” has become a well-worn phrase since the introduction of transit asset management (TAM) reporting requirements in 2012’s Moving Ahead for Progress in the 21st Century Act (MAP-21) surface transportation bill. That legislation and subsequent federal law and regulations require transit agencies to produce a plan to maintain assets in a State of Good Repair. For small urban, rural, and tribal reporters, transit asset management reporting and planning is often facilitated by state departments of transportation, but data collection for these efforts still falls to local agencies. The foundation for a TAM plan is an asset inventory, which catalogs the rolling stock, service vehicles, and facilities operated by an agency. The condition of each of these assets must be assessed to determine whether the asset is in a State of Good Repair.
For revenue and service vehicles, an assessment of state of good repair is often based on vehicle age, but the types of data used to make this judgment may be increasing in the future.
The most straightforward judgment of whether a vehicle is in a state of good repair is whether its age has exceeded a useful life benchmark (ULB) for its vehicle class. Of course, each agency (and each vehicle or asset) will experience wear and tear differently, so TAM plans may modify useful life benchmarks based on other factors. In the future, more state agencies creating TAM plans may take into consideration factors like mileage and maintenance history when determining whether an asset has exceeded its useful life.
This will increase the amount of data tracked in asset inventories that transit operators must then collect and maintain.
Additional data on asset quality and maintenance come with the benefit of improved forecasting of capital needs and maintenance requirements. The asset data collected for a TAM plan will inform financial and capital planning models (often referred to as decision support tools) that guide how investments are prioritized. Models based on this data can also help to communicate the implications for service reliability and performance if investments are not made. For agencies themselves, increased data collection on assets–and the sub- assets within an asset, such as vehicle engines, wheels, fareboxes, and so forth—can support more pro-active, predictive maintenance work that minimizes disruptions to service from breakdowns. Opportunities to better track the condition of assets with new technology and analyze this data will be discussed in subsequent sections.
In addition to vehicle, technology, and facility assets, the state of bus stop assets is also important to track so that they can be repaired or replaced when necessary. Bus stop assets are particularly important to customer satisfaction as they are often the first piece of the transit system that passengers see. Bus stop assets can be tracked efficiently through Geographic Information Systems (GIS) databases.
Safety Incident Reports
Patterns of transit vehicle collisions and other safety incidents can be used by agencies to target risk reduction measures that improve the safety and health of staff and the public. In the case of a safety incident, many agencies file a report or obtain copies of police reports. As defined by NTD, safety incidents include injuries, fatalities, collisions, significant property damage, and evacuation of a transit vehicle or facility. As a data source, detailed safety incident reports allow agencies to identify risks or patterns that can be addressed to improve the safety of their transit service.
After the occurrence of a safety incident, involved staff typically file a report identifying the route, the agency’s vehicle, other vehicles, all persons involved, a count and description of injuries or fatalities, property damage estimates, and a narrative of what occurred, along with basic information such as the date, location, and time. Enforcement of agency policies regarding the completion of safety reports is important to ensure full coverage of safety data. Incidents that go unreported will reduce the reliability of safety statistics and will reduce opportunities for aggregate metrics such as the number of safety incidents per 10,000 passenger trips.
Greater detail in safety reports will expand the possible use cases for safety incident data. Filling out additional fields requires minimal marginal effort, with important insights made possible as a result. Consistency between reports is also key to enabling aggregation and comparison of quantitative safety metrics. However, many pieces of data will not be applicable to all types of safety events, limiting the usefulness of analyzing such data in aggregate. In addition, a large share of safety incident data is qualitative information that describes events in detail, which is difficult to compare or aggregate. Such qualitative fields, which are often critical for understanding individual events, may not be as useful for analysis.
Analysis of safety incident reports may reveal patterns, such as a vehicle’s stairs with numerous falls or an individual driver with multiple incidents. By identifying patterns, agencies can take risk reduction measures, including additional training, vehicle maintenance, and procedural changes. In combination with other data sources, quantitative metrics that use safety incident data may include:
- Safety incidents per 10,000 passenger trips
- Safety incidents per 10,000 revenue hours
- Annual injuries and fatalities
- Frequency of safety incidents by type (e.g., fall, breakdown, collision, property damage, crime).
Customer Service Complaints
For most transit riders, the only agency staff they interact with is their driver. By soliciting customer feedback via phone call, text, email, mobile application, or an online form (see Figure 5), agencies bridge the gap between the rider and decision-making staff. In order to observe trends and track customer satisfaction over time, agencies may record the complaints—or kudos!—they receive in a spreadsheet or database to enable comparison and aggregation.
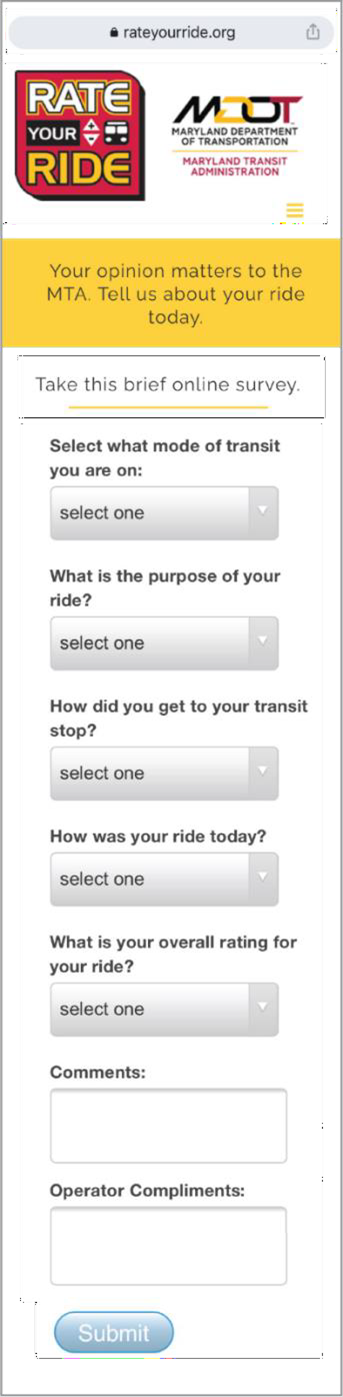
Customer feedback ranges from positive experiences to issues with on- time performance, personal comfort and safety, cleanliness, crowding, and behavior of staff. Typically, complaints are collected as a written comment with basic information regarding the route or service in question and the time. Some agencies may collect additional information with complaints, including the trip purpose, origin and destination, or the vehicle number.
These supplemental details may help identify exactly how and why the rider experienced a specific issue. Qualitative responses are also important to make the rider feel heard and understood in their complaint.
However, the qualitative nature of customer service complaints and the different ways it is collected (e.g., through customer service representatives, dispatch, drivers, etc.) often limit the types of analysis possible with such data. Strategies to enable analysis include using categorical data (e.g., “drop-down” selection boxes in a form) instead of open-ended inputs, collecting quantitative data such as a satisfaction rating, and centralizing data from different sources into a master database. Another common challenge with analyzing customer service data in aggregate is the sample size. Relative to the total ridership on a service, customer service data may not be statistically significant. With a large enough sample of quantitative or categorical data, an agency can compare complaints and customer satisfaction between services and track changes over time.
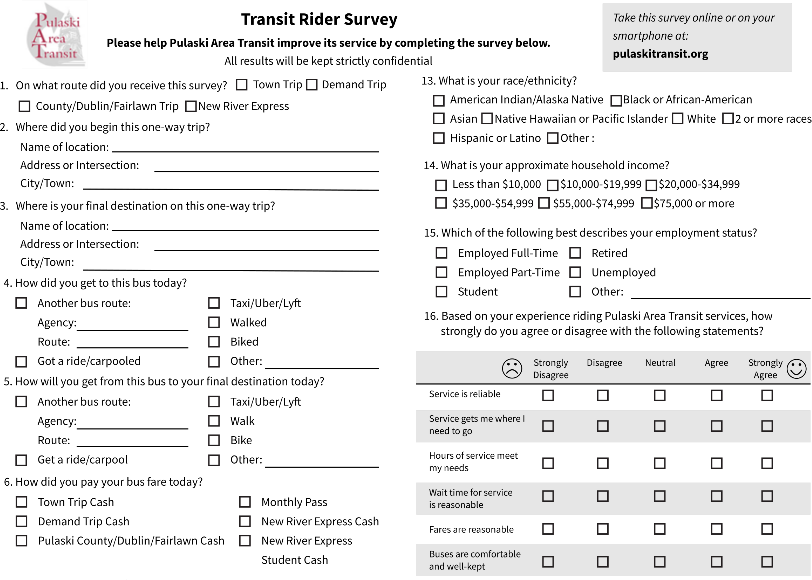
On-Board Customer Surveys
A customer survey (sometimes referred to as an on-board survey or intercept survey) reveals who rides transit services, and how. During these survey efforts, an agency engages with its customers onboard its vehicles or at transit stops to learn more about them: their age, income, trip purpose, or other characteristics. The most sophisticated surveys are origin-destination (OD) surveys that capture more detailed information about how customers use transit to make their trips. While on-board surveys are a required element for larger, urban agencies that must conduct Title VI service analyses, they can nevertheless play a useful role for smaller agencies and regional planning bodies looking for data to support planning studies and conduct evaluations of service and fare quality.
When planning a customer survey, the most important consideration for an agency is determining how many responses are needed or the sample size. While an agency may have no expectation of a particular response rate for an online customer survey or a survey about changes to a transit system, the sample size is an important consideration for on-board customer surveys. In order to generalize from a few responses to the entire system, it is important to obtain a sample that reflects the agency’s full spectrum of customers—from the first trip of the day to the busiest trip, and from the most frequent services to a quieter route. The calculation of sample size will also play a role in how many staff are required to conduct the survey. Resources provided at the end of this chapter provide straightforward ways for agencies to determine sample size, design a survey, and execute it successfully.
Increasingly, large agencies are relying on emerging data sources to supplement or replace the data gathered from origin-destination on-board surveys. These data sources include synthetic origin- destination data created from AVL and APC data to data about customer travel behavior purchased from private providers. These new sources are discussed in the following section, Passive Data Sources.
Passive Data Sources
Passive, or automatic, data sources collect information using electronic sensors and cellular technology. These devices are capable of generating large volumes of highly granular data, creating a data point every second or less. Data from passive sources provide a wealth of information, typically including timestamps and enabling many levels of analysis by route, vehicle, stop and more. Although these technologies carry a higher capital cost than manual data sources, passive sources have lower marginal costs as well as increased data coverage, availability, and reliability.
Automatic Passenger Counting
Automatic passenger counting (APC) devices measure boardings and alightings at the door of a transit vehicle. As a passive data source, APC collects data whenever an equipped vehicle serves passengers. If not all vehicles are equipped, however, agencies must work to ensure that vehicles are rotated across routes so that trips are sampled adequately.
Most APC devices use a camera or infrared sensors to count how many passengers enter or exit the vehicle at an individual door. The resulting data is highly accurate, except under circumstances of miscalibration or extremely high bus load with many passengers boarding and alighting at the same time. For buses or trains with multiple passenger doors, it is important to have a device at each door to achieve a complete count. Although ridership data from APC devices is typically more reliable and comprehensive than a manual sample, agencies must periodically validate APC counts by performing manual ridechecks in order to use the data for NTD reporting. Many APC devices can also be linked to bike racks and wheelchair ramps to provide data on how often they are used.
APC data is often linked with stop location data to determine the boardings and alightings at each stop. Planners have the ability to analyze ridership levels for individual stops, trips, and routes and can identify trends over time. Due to the large volume of data, such analysis may require staff with more advanced data analysis skills.
Automatic Vehicle Location
Automatic vehicle location (AVL) devices use GPS technology to record the location of a bus at a specified time interval or its time of arrival at a particular location. While a bus is in use, an AVL device records location data nearly continuously. When used for real-time arrival information or service monitoring, these cellular-enabled devices will transmit the vehicle’s location to a central server once every thirty to sixty seconds. In mountainous or remote terrain, either the GPS location of the vehicle may be inaccurate or the ability to transmit the location of the vehicle may be impeded. Once the data is transmitted and processed, it can also be linked to customer-facing applications and webpages, giving customers the ability to see where their bus is currently located. After a vehicle ends its service for the day, more detailed AVL data can be downloaded from the vehicle for further processing and analysis.
Given the high rate of data collection, AVL devices produce very large volumes of data for each bus. Typical AVL systems will produce metrics including on-time performance, runtime, and dwell time for each trip. However, more complex analyses may require staff with advanced data analysis skills. Further uses of AVL data are discussed in Chapter Four: Planning and Performance Monitoring.
Automatic Fare Collection
An automatic fare collection (AFC) system is an electronic fare system that often includes fareboxes, fare machines, and customer-facing websites and mobile applications that allow for fare transactions. With an AFC system, passengers can pay using a smart card, a mobile app, cash, or other smart fare media.
These systems utilize complex datasets representing all financial transactions, fare payments, and transfers across an agency’s services.
The parts of an AFC system vary greatly depending on the size of the system. A small system may consist of only electronic fareboxes and a mobile application, whereas a large system could also include hundreds of fare machines, thousands of fare gates, and a detailed website for registering, loading, and managing smart card accounts. In every case, data is automatically collected from all devices into a central database, from which queries and analysis can be conducted. Many systems provide a user-friendly interface for viewing AFC data without requiring serious data analysis skills.
Compared to traditional fare collection methods, including cash, tokens, and paper tickets with simple fareboxes, AFC systems require lower marginal cost with high reliability and availability of data. Since the system is fully digital and mostly cashless, the majority of financial data is readily available without transporting and counting cash or tokens. Capital costs may be high for an AFC system since the entire fare system must be replaced at once. However, AFC also comes with significant savings in upkeep since most transactions are automatic and digital, requiring no exchange of physical fare media.
AFC data may include a wide array of data points to represent all fare types and all fare media, including every transaction and usage of fare with the corresponding fare amount. Such transactions include loading a smart card, purchasing a single fare or fare pass, using a pre-purchased fare, making a transfer, exiting a fare gate, or paying with cash. In addition to the transaction type and amount, AFC data captures the time, vehicle or fare gate, route, account number, and in some cases, the location of the transaction.
The uses for AFC data extend from financial analysis, such as revenue measurements and financial efficiency of services, to advanced insights on how passengers use the service, such as transfer analyses and ridership behaviors of anonymous individuals. As with manually collected farebox records, AFC data is also often used to validate ridership counts.
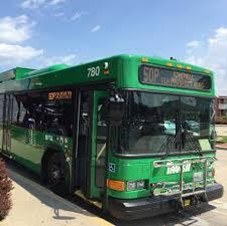
Agency Profile: Frederick Transit Technology Adoption
Frederick transit has implemented apc, avl, and mobile ticketing systems, in addition to moving their fixed-route bus fleet over to electric vehicles.
Context
Over the past several years, TransIT, a small urban agency in Frederick, Maryland, has implemented a number of technology upgrades to improve the passenger experience, data collection, and data reporting. These upgrades included installing automated passenger counters (APC) and automatic vehicle location (AVL) devices on its fixed-route fleet, launching a new mobile ticketing app, and purchasing nine fully electric vehicles.
Resources Needed
TransIT’s technology upgrades required financial and personnel resources. Federal Transit Administration (FTA) capital grants were used to purchase hardware for the APC and AVL systems and electric vehicles. The implementation process also required personnel resources on a number of dimensions. Operators needed training on how to log into new tablets installed in each vehicle for the APC/AVL system and how to record fares on tablets properly. Data analysts needed to learn how to use and download data from Route Match software, while other staff needed to learn how to properly program Route Match software to include the agency’s schedule. As part of the purchase, APC/AVL vendors provided IT support, and county IT staff also helped with troubleshooting.
Results
TransIT’s technology initiatives transformed the way the agency collected and analyzed data and has vastly improved the customer experience.
Vehicle tracking and schedule adherence have been automated with the AVL system. The entire fixed-route fleet was equipped with AVL, allowing passengers to see where their bus is located and its estimated arrival via the Route Shout mobile app.
Ridership reporting is also streamlined. The AVL system is used to track bus locations and for the drivers to record fares collected, from which overall ridership is derived and reported to the National Transit Database (NTD). The APC system is used for detailed data analysis at the stop level.
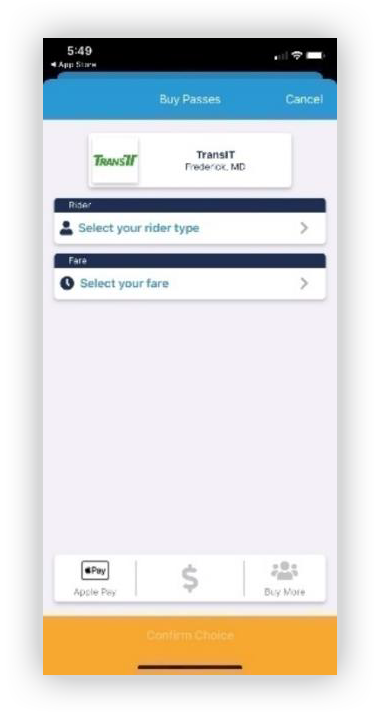
Mobile ticketing has improved the collection of fares and made purchasing fares easier for riders. It has also improved fare reconciliation, as reports the vendor, Token Transit, provides fare reports that can be compared to what
drivers have entered into their tablets.
Data collection for the AVL and fare systems are linked through the drivers’ tablets. Drivers enter fares into the tablets that were provided with the AVL system, and then all of this data is able to be accessed by agency staff.
While TransIT’s electric vehicles have cut down on fuel costs, they do not currently have any dashboards for reporting metrics on the fleet. The manufacturers for their electric vehicles, Complete Coach Works and BYD, have partnerships with external vendors that provide dashboard reporting, but TransIT does not currently use them.
Lessons Learned
TransIT staff noted several lessons learned throughout the process of implementing these new technologies. They include:
- Ensure that vendors understand the data formatting required for NTD reporting
- Review platforms and user interfaces before purchase to ensure they are intuitive and easy to use for drivers
- Keep some system redundancy for the first year when installing new technologies to help with data validation and unexpected issues with the new systems
- Consider vehicle requirements when switching from diesel to electric vehicles.
Due to charging limitations, one-to-one replacements of vehicles often cannot be made. TransIT uses their electric vehicles during the peak periods and recharges them at their garage during the midday period. Careful attention needs to be paid to charging times and battery life, particularly during the times of the year when HVAC systems will be operating.
Key Takeaways
- Technology upgrades are essential to increasing the accuracy of an agency’s data and increasing data collection efficiency.
- Different technologies can be integrated to improve data validation and ease of use.
- New technologies should be vetted before purchase. Redundant systems should be in place during implementation of new technologies to ensure data consistency and system reliability.
For More Information
Visit: Frederick TransIT
Emerging Advancements
While sensor-based, passively generated data is increasingly part of the state of the practice for transit agencies, emerging technological advances are changing how such data is generated from internet- connected parts and systems to customer cellphone location data, to the data generated as agencies provide more customized services.
Internet of Things (IoT) technologies
A detailed asset inventory is the foundation of transit asset management, but maintaining this data can become more time-consuming as fleets grow in size or requirements for data collection increase. Internet of Things (IoT) devices are internet-connected, physical equipment that can relay information about their status or be controlled remotely. A handful of large urban transit agencies like MARTA in Atlanta are beginning to incorporate IoT-based data collection for transit asset management, and this trend may eventually spread to other agencies.4
IoT devices are equipped with sensors that relay information about vibrations, pressure, heat, power usage, and other conditions to central servers. For some IoT-equipped facilities, these devices can be used to better regulate building energy costs from heating, air conditioning, and lighting. For vehicles and other transit assets, IoT data can then be used to predict the health of the asset and inform capital investment decisions. In extreme cases, these signals can also be used to signal a need for preventative maintenance before the asset fails. The introduction of sensors is not without costs: sensors must be installed, calibrated, and maintained, and processing the data from these sensors will require software licenses that may be cost-prohibitive to agencies, especially for relatively small fleets or facilities. As applications of IoT continue to develop in the transit industry, the potential for small urban, rural, and tribal agencies is likely to continue to improve.
Many large and small agencies with battery-electric buses have already entered the realm of IoT-enabled assets. Electric buses automatically collect and transmit data such as battery levels, power consumption, and battery health in real-time to allow dispatchers to maintain a sufficient charge on each vehicle. Many buses also keep a full record of vehicle speed and braking, which provide insight into the most power- efficient driving styles. With real-time access to these metrics, agencies can move toward intelligent dispatch of electric vehicles based on their battery levels and the availability of charging infrastructure.
Moreover, agencies are learning how to best procure internet-enabled assets and implement sophisticated data management practices. As the transit industry explores complex IoT technologies like self-driving vehicles and connected infrastructure, the systems and processes developed for battery- electric buses are opening doors for agencies of all sizes.
Aggregate Cellphone Location Data
While on-board customer surveys can provide rich data on who riders are and how they use a transit system, the manual data collection effort they require mean that survey data is infrequently gathered, limited in the extent of routes or times that are covered, and expensive to procure. Especially as travel patterns have shifted drastically during the Covid-19 pandemic, with many rural areas seeing an influx of urbanites and normal work travel disrupted, having up-to-date and detailed travel data can be useful to transit agencies.
One of the solutions to this challenge pursued by some larger agencies is to use aggregate cellphone location data purchased from a vendor such as Streetlight or AirSage. These data providers obtain, aggregate, and anonymize Location-Based Services (LBS) data. LBS data consists of the location ‘pings’ generated by cellphones when certain apps request location information from a phone, as well as other Global Positioning System (GPS) and cellphone triangulation data. Though rural areas may have incomplete cellular coverage, the wide array of location data sources that feed into LBS datasets can help to correct for gaps in coverage; an example of LBS data as processed by Streetlight is shown in Figure 9. In addition to LBS data, certain transit trip planning apps such as Moovit and Transit offer datasets on trip itineraries that users select in addition to their locations.
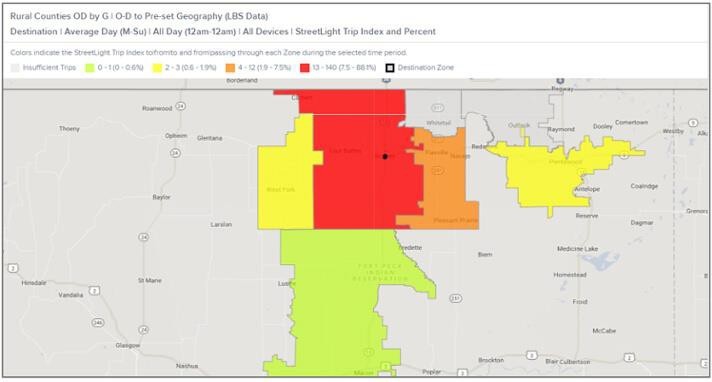
For transportation providers, these platforms provide information on origins and destinations and travel speeds on roadways. In some cases, the mode of transport and demographic characteristics of travelers can also be inferred. Because of sample size and privacy concerns, this data is often not available for rural areas at the fine-grained level of detail of urban areas, but these datasets may be useful for identifying volumes of travel between rural towns for long-distance services. State departments of transportation and regional planning bodies may be able to obtain this data for your service area.
Additional uses of origin-destination data are discussed in Chapter Four: Planning and Performance Monitoring.
4 Keenan, Sean Richard. “MARTA is turning to the Internet of Things to lower costs, reduce system hiccups.” Curbed Atlanta. View article here (external link). Accessed January 13, 2021.
Conclusion
Data sources are the fuel for data practices that inform planning decisions, foster strong partnerships, and answer critical questions about system use. These sources range from a variety of manually generated sources—ridechecks, safety records, and customer feedback—to automatically generated, often sensor-based datasets. Automatic or passive datasets like automatic passenger counters are commonly found among larger agencies and may steadily become more available for small urban, rural, and tribal agencies as well. On the horizon are new sources of data like aggregate cell phone location data that may eventually become part of the state of the practice. Use the checklist on the next page to assess what data sources your agency currently has and what it needs to consider obtaining.
Checklist: What are your agency’s available data sources?
| Manual Data Sources | Description | Currently Use This Data Source | Want to Obtain This Data |
| Manual ridechecks | Sampled boarding and alighting counts by trip and stop | ||
| Trip requests and trip logs | Demand response trip information recorded by drivers, including riders, distance, and fare payment | ||
| Asset management and maintenance data | Asset inventory and condition data | ||
| Safety incident reports | Information recorded after safety incidents | ||
| Customer service complaints | Customer feedback or ratings | ||
| On-board customer surveys | Sampled data on trip characteristics and passenger information |
| Passive Data Sources | Description | Currently Use This Data Source | Want to Obtain This Data |
| Automatic Passenger Counting | Boarding and alighting counts for every stop | ||
| Automatic Vehicle Location | Location data for a bus, associated with a route and trips | ||
| Automatic Fare Collection | Automatically generated fare transaction data | ||
| Transit smart card data | Transaction and travel data associated with individual accounts |
| Emerging Data Sources | Description | Currently Use This Data Source | Want to Obtain This Data |
| Internet of Things (IoT) devices | Sensor-equipped physical devices that relay device condition data | ||
| Aggregate cellphone data | Origin-destination and travel speed data generated from cellphone location data |
For automatic sources, data formats and standards are important for storing data consistently and translating data between formats to meet particular uses. In the next chapter, we’ll examine common data sources and their importance to an agency’s data practices.