Data Practices Chapter 2 – Data Standards
- Date: February 18, 2022
Jump to section
Having good data is the first step to having better tools for planning, reporting, and providing information to customers, but how agencies handle and process data matters greatly.
Data standards provide a way for organizations to store and use data in a logical and accessible way, helping agencies with internal reporting and facilitating dissemination of data to the public.
This fact sheet provides an overview of established and emerging data standards that can be useful to small agencies and provides examples of how these standards are being implemented in small agencies around the country.
Existing Standards and Emerging Advances
Existing Standards: GTFS Schedule Data
General Transit Feed Specification (GTFS) has become the de facto standard for tracking and disseminating schedule data. It can be used in Google Transit as well as many other transit route planning applications.
Emerging Advances: GTFS- Flex
GTFS-Flex is an extension to GTFS that provides information about flexible transit services, including demand-response and deviated fixed-route services.
Existing Standards: Real- Time Arrivals
In addition to schedule data, GTFS-RT provides real-time updates to riders, like stop closures, route changes, or bus delays.
Emerging Advances: GTFS Validators
Inaccuracies and errors in GTFS feeds impede their usefulness. GTFS validators test GTFS feeds for a variety of feed issues, and some validators also test for data quality.
Existing Standards: Transit Asset Management
Transit Asset Management tools provide standardized procedures for tracking the condition of vehicles and other transit assets.
Emerging Advances: Intelligent Transportation Systems (ITS)
ITS systems, including AVL, APC, and AFC, are becoming more common ways to collect ridership data and performance metrics. Standards can help to facilitate the use of this data.
Existing Standards: Ridership Data
Transit Asset Management tools provide standardized procedures for tracking the condition of vehicles and other transit assets.
Emerging Advances: Demand- Response Standards
TCRP has published data standards that, if adopted, could make collecting, sharing, and coordinating data across demand-response service providers more seamless.
Existing Standards: Internal Standards
Creating standardized methods to track internal data can help agencies better use the data they already produce.
Introduction
Having good data is the first step to having better tools for planning, reporting, and providing information to customers. Standards can be either formal data practices developed by industry leaders that allow for consistency among vendors and agencies, or standards can be less formal data management practices defined at each agency to ensure internal consistency. Unlike standard operating procedures or other process guidelines, the data standards and management practices here inform the structure and format of data. Because they allow users and applications to process important information quickly, standards are a key determinant of how much agencies–as well as customers and stakeholders–can learn from what they have collected.
General Transit Feed Specification (GTFS) feeds are the canonical example of data standards in transit. Because of the standardized format, trip-planning applications can help customers plan trips for any transit service that publishes a GTFS feed to consume agency schedule data regularly. Validator applications can also help agencies catch potential errors in their GTFS feed files. For other types of data, agencies may need to develop their own internal standards. Internal agency standards can help ensure that staff from different departments know about available datasets, communicate about what they need from the dataset, and contribute to their creation and upkeep. Formalized data structures, which remain consistent across time, can lead to faster, more accurate, and easier reporting, as the setup required to process the data can be reused in the future.
Trends in the industry include moving towards formats that allow for real-time data to be disseminated to customers and include flexible transit data in trip planning applications. Extensions to GTFS feeds can allow agencies to do both. GTFS-RT builds on the GTFS framework to provide real-time data like bus delays, temporary stop closures, or other pertinent information to riders. GTFS-Flex extends the GTFS framework to flexible transit, like demand-response or deviated fixed-route services. Also, ridership data collected from Automatic Passenger Counts (APC) or Automatic Fare Collection (AFC) data is beginning to be used more widely, including among small and rural transit agencies, and combined with Automatic Vehicle Location (AVL) data. Converging around standards for APC, AFC, and AVL data will allow agencies to process and disseminate this data much more easily. See Chapter 3: Open Data for more information about collecting data.
Collecting and managing data can take time and effort. Agencies can choose to do this in- house, which may require significant staff time and knowledge, or manage data using proprietary software, which may be more f lexible but with a higher up-front cost.
This chapter provides an overview of existing standards, emerging standards, and internal methods for improving data management that small urban, rural, and tribal agencies can leverage to use the data available to them better. As defined here, data standards are uniform methods for collecting, storing, and processing data. This chapter also provides several examples of how data standards and practices are being implemented in small and rural agencies around the country.
State of the Practice
GTFS Schedule Data
General Transit Feed Specification, or GTFS, is the de facto standard for disseminating transit schedule data in the United States. Before GTFS was developed, each transit agency was responsible for publishing schedules in PDF format on their website or assisting riders who called a helpline, creating barriers for riders to find up-to-date information. Since multiple transit providers might exist in the same area, riders might also have to navigate multiple websites, schedules, or help lines. In addition, travelers or tourists might not be familiar with the local transit providers and might not know where to look for information.
To address these concerns, Google and TriMet, a transit agency in Portland, worked together to create the first GTFS feed in 2005.5 They used TriMet’s data and created a prototype of the GTFS feed, aiming to make the data format easily replicable so that it could be widely used. The ability to provide customers with journey planning through the popular Google Maps app and open source tools like OpenTripPlanner led to the steady adoption of the GTFS format.
GTFS feeds are produced in a standardized way using schedule and geographic data. The file structure is relatively simple: it is a collection of tables stored as comma-separated text files in a zipped folder. The tables are a decomposition of transit schedules into their constituent parts—stops, routes, trips, and so forth—with the relationships between these tables defined through common ID fields. This structure allows for efficient storage of large amounts of information. GTFS feeds require certain files and fields, while other files are optional, as shown in Table 2.6 GTFS was designed to use tables to ensure that it could be edited and used with a variety of programs and coding languages.7 Google provides resources to help agencies create GTFS feeds and submit them for use in Google Maps.8
Table 2: Required and Optional GTFS Files
| Required GTFS Files | Optional GTFS Files |
| Agency.txt | Fare_attributes.txt |
| Stops.txt | Fare_rules.txt |
| Routes.txt | Shapes.txt |
| Trips.txt | Frequencies.txt |
| Stop_times.txt | Transfers.txt |
| Calendar.txt or Calendar_dates.txt | Pathways.txt |
| Feed_info.txt | Levels.txt |
| Translations.txt | |
| Attributions.txt |
Standardizing the data used to provide schedule information in Google Maps allowed other agencies to take advantage of this new technology by providing their data in the same format. Since GTFS feeds were designed with simplicity in mind, this allowed agencies to access to powerful trip planners like Google Maps or to deploy an agency-deployed trip planner at a relatively low cost. The open data format allows Google and other application developers to use this data to create journey-planning applications easily.
5 Bibiana McHugh. 2013. “Chapter 10: Pioneering Open Data Standards: the GTFS Story” Beyond Transparency. View the reference article here (external link)
6 Google. “Static Transit: Reference” Google Transit APIs. View the reference document here (external link)
7 McHugh, “Chapter 10”
8 Google. “GTFS Static Overview.” Google Transit APIs. View the reference document here (external link)
Today, thousands of agencies worldwide publish GTFS feeds.9 GTFS data enables easy trip planning for transit riders, improving customer information.10 It allows agencies of all sizes to take advantage of cost savings by relying on third-party application developers. In addition, GTFS allows for analyses of accessibility and other performance metrics, such as route frequency. The original GTFS feed format, which published schedule data for fixed-route services, is being expanded to other applications, like providing real-time arrival information and information about flexible transit services (see the next section, Emerging Advancements).
9 As of January 27, 2021, 1,327 providers are listed on OpenMobilityData and over 2,500 providers are listed on Transitland.
10 Transportation Research Board. Pending publication. “TCRP G-18: Improving Access and Management of Transit ITS Data. View the reference document here (external link)
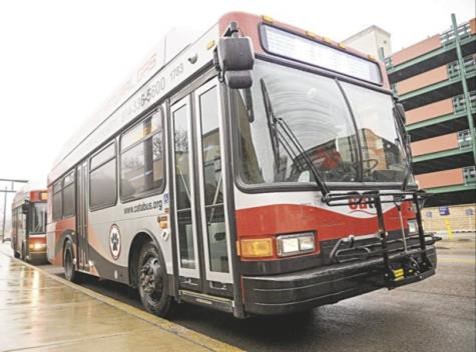
Agency Profile: Crawford Area Transportation Authority Use Of The Rtap Gtfs Builder
The crawford area transportation authority (cata) deployed a gtfs feed in october 2019 using the rtap gtfs builder.
Agency Profile: Crawford Area Transportation Authority Use Of The Rtap Gtfs Builder
The crawford area transportation authority (cata) deployed a gtfs feed in october 2019 using the rtap gtfs builder.
Context
Crawford County and Venango County, Pennsylvania consolidated their transit services in 2016, with Venango County Transit merging into the Crawford Area Transportation Authority (CATA). South of the city of Erie, Crawford County borders Ohio and is centered on the city of Meadville. Venango County is just to the southwest of Crawford County. The agency operates 13 fixed routes, including three in the Meadville area, one in the Titusville area, four in Venango County, and an additional five in rural areas of Crawford County (known as “lifeline” routes). Lifeline routes generally operate only two to three days per week, whereas other routes typically operate Monday through Saturday except for the Titusville route, which operates Monday through Friday.
The consolidation of services required a merging of both agencies’ datasets, which were in very different formats. To accurately merge data, create a better inventory of stops, and improve trip planning for customers, the agency created a GTFS feed, launched publicly in October 2019. Staff utilized the National Rural Transit Assistance Program’s (National RTAP) GTFS Builder to create the GTFS feed and created a new stop inventory and route alignments in Google Earth.
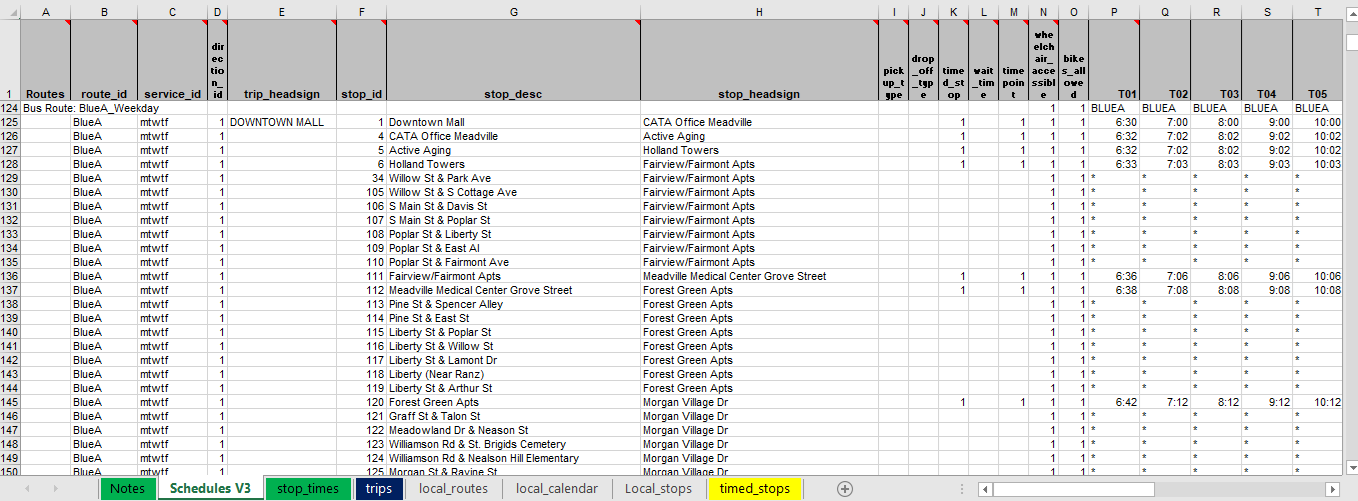
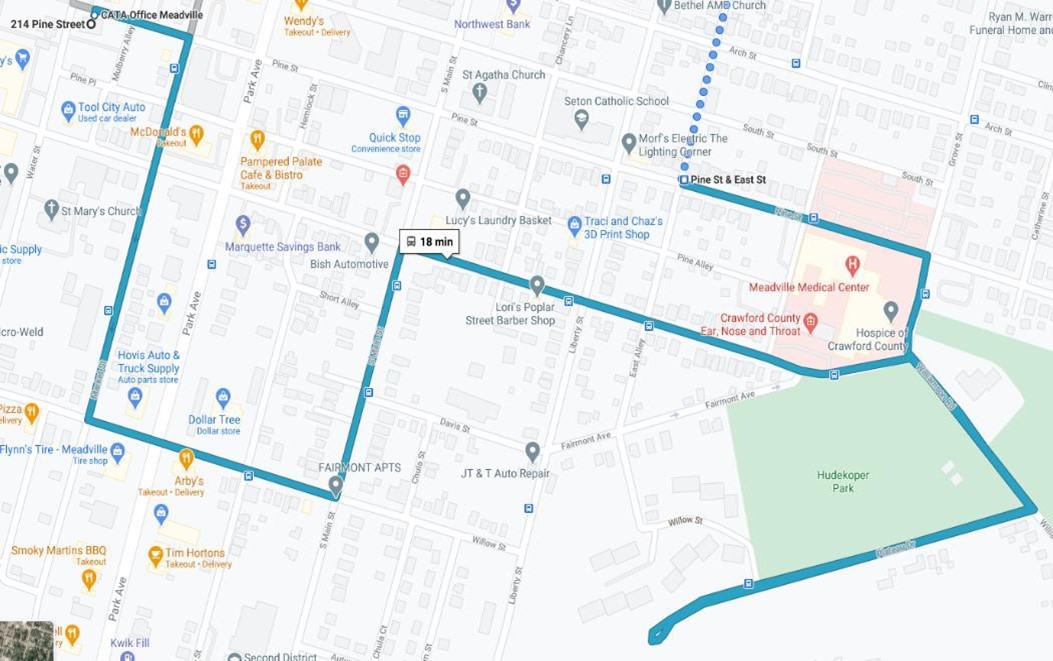
National RTAP’s GTFS Builder consists of two Excel files. Users input schedule data (routes, stops, stop order, stop times, calendar, etc.) into one spreadsheet and then run a macro that generates the schedule into GTFS format. The schedule GTFS data is then copied into the second file called ImportExport, and additional data such as agency information, fares and service dates are added. Finally, the entire ImportExport file is exported into a complete GTFS data feed. GTFS Builder works well with free applications such as Google’s MyMaps and Google Earth to geocode bus stops and draw route shapes.
Similar to other GTFS applications, once the GTFS feed is exported from GTFS Builder, agencies selecting Google Maps as a trip planner will need to sign up, sign a license agreement and create a partnership account with Google to upload the feed. National RTAP offers an in-depth review of a sample license agreement. The feed then undergoes two steps of validation, one to verify that schedules are accurate and match with what is on the agency’s website, and another to make sure the tables internal to the feed are cross-validated and there are no missing data points or major errors.
Resources Needed
Transit agency staff need to create a National RTAP cloud account and log in to download the Builder, and then begin using it. Before inputting agency data into the Builder, users need to create the route and stop spatial data in a GIS program or Google Earth. They also need to have the schedules by route and direction with stop times constructed. From there, the data can be entered into the Builder intuitively. An RTAP staff member is dedicated to helping agencies use the Builder.
CATA staff spent approximately four months creating their first GTFS feed using Google Earth and the Builder. The agency did not have an accurate bus stop inventory nor any spatial files for routes, so planning staff and operations staff had to first inventory stop locations and confirm route alignments. From there, a planning staff member was able to draw route alignments in Google Earth and set bus stop locations to get coordinates for each stop. With the help of RTAP staff answering questions about the Builder, this staff member was then able to build the bus stop inventory and GTFS feed, have it validated with Google, and update it whenever service changes are made.
There are no special skills required to use the Builder, other than a basic working knowledge of Excel and Google Earth. Users do not need to know how to build macros, and RTAP staff can help with troubleshooting issues that arise in the process. CATA staff mentioned that organizational skills are helpful when using the Builder, as data needs to be well organized even before entering it into the Builder’s spreadsheets. In particular, stop ID’s and stop names should be consistent across routes; before going through this process, CATA’s stop ID’s differed between routes, which would have led to issues when creating the feed with the RTAP GTFS Builder.
Results
The use of the Builder and the creation of the GTFS feed brought a number of positive results and changes to the agency, such as:
- The agency was able to build a trip planner into their website that passengers can now use to plan their trips. Passengers can also use Google Maps in a web browser or in a mobile app to plan trips.
- The feed and trip planner’s creation drastically reduced the number of phone calls to the agency requesting trip planning assistance. In the first year of the GTFS feed being live, over 1,000 people used the trip planner on their website.
- The feed’s creation also forced the agency to better organize its data, particularly stop locations and route alignments. Updates to the GTFS feed are now very simple to make.
- The creation of the feed also had several unforeseen positive outcomes, one of which was simplifying the creation of route brochures. Now that the agency has stops and route alignments in Google Earth, which they can send to their brochure maker instead of having to sketch out route alignments and stop locations manually.
Lessons Learned
CATA staff noted some lessons learned when creating their GTFS feed using the RTAP GTFS Builder. They include:
- Organizing stop locations, stop ID’s, and stop names before using the Builder
- Making sure the times assigned to stops on your agency’s website are accurate
- Using National RTAP staff as a resource as much as possible, particularly when running into error messages in the validation process with Google
- National RTAP staff can help clarify new terms, expedite best practices, and review data input into GTFS Builder.
Key Takeaways
- Creating a GTFS feed is a great way to organize your agency’s schedule data to provide trip planning services for your customers.
- The RTAP GTFS Builder provides a free framework for organizing a GTFS feed that only requires basic Microsoft Excel skills and some beginner knowledge of Google Earth.
- Small agencies can create GTFS feeds with their existing staff and do not need to hire outside specialists. Once feeds are created, they are easy to maintain using the Builder and can lead to new efficiencies with creating schedule brochures and other tasks.
For More Information
Visit: CATA and Venango County Transit
Visit: RTAP GTFS Builder
Visit: Google Earth
Visit: GTFS Overview from Google
Watch video: Demystifying Trip Planner Licensing Agreements
Real-Time Arrivals
A GTFS feed can help the customer plan their trip but will not help them know whether their bus will be on time–or even if it has been temporarily rerouted away from their stop. GTFS-Realtime (GTFS-RT) is an extension to a traditional GTFS feed that attempts to solve this problem. It includes: trip updates, like delays, cancellations, or route changes; service alerts like moved stops; and vehicle positions, including location and congestion. Since it provides real-time information, it must be updated frequently—up to once every five seconds—using Automatic Vehicle Location (AVL) data.11 Google Maps currently supports GTFS-RT in Boston, San Francisco, San Diego, Portland, Madrid, and Torino and provides resources for other agencies to construct and deploy GTFS-RT.12
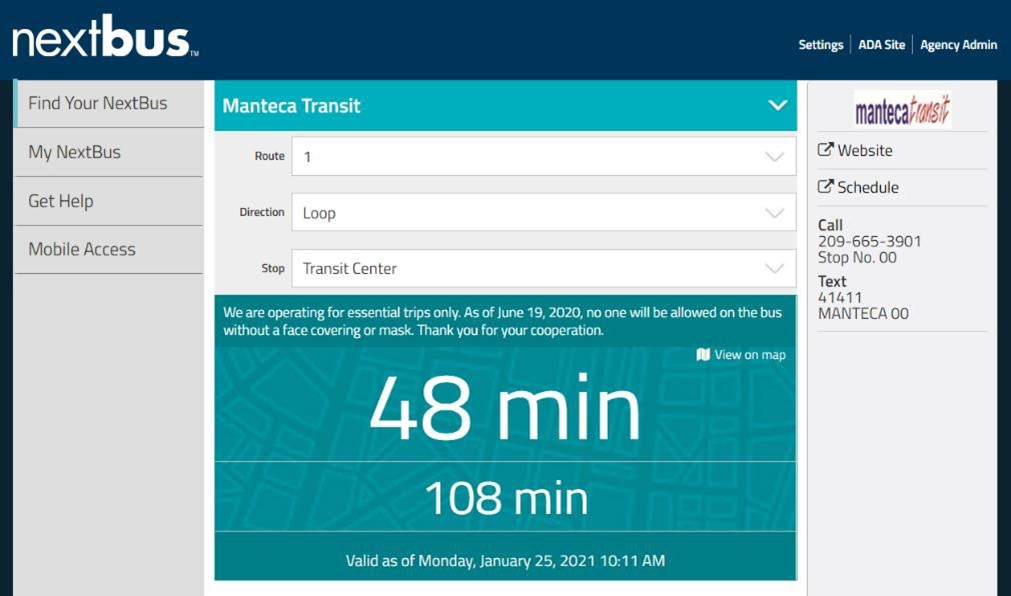
In addition to Google’s format, other developers have created open-source or proprietary formats to provide real-time bus information that use GPS or AVL data to locate buses. OneBusAway is an open- source example that provides real-time information, available through the OneBusAway app or with the agency’s own branding.13 TheTransitClock is another open-source system that converts AVL data to real- time information, operating in the Twin Cities in Minnesota.14 NextBus is a proprietary software owned by Cubic that provides similar services, offering a web and mobile application that provides real-time transit information.15
NextBus is the most widely used, providing real-time arrival information for approximately 75 systems, including small urban and rural transit systems like Manteca Transit in California, Winston-Salem Transit Authority and Greenville Area Transit in North Carolina, EZRide -Charles River Transportation Management Association (TMA) in Massachusetts, and AppalCART in North Carolina. NextBus is a logical choice if an agency already uses other Cubic services. OneBusAway and TheTransitClock are both open-source and can be deployed in-house with an IT team or with assistance from a nearby university or independent developer.
11 TRB, “TCRP G-18.”
12 Google. n.d. “Create a GTFS-realtime feed.” Transit Partners Help. Accessed January 20, 2021. View the reference document here (external link)
13 OneBusAway. n.d. “Homepage.” Accessed January 20, 2021. View the reference website here (external link)
14 TheTransitClock. “Homepage.” Accessed January 20, 2021. View the reference website here (external link)
15 Cubic. n.d. “NextBus: Real-Time Passenger Information. Accessed January 20, 2021. https://www.cubic.com/solutions/transportation/nextbus, https://www.nextbus.com/#!/ttc/5/5_1_5B/1405
Transit Asset Management Data
Safe and reliable service depends on agencies maintaining their transit vehicles and assets in a state of good repair, but the data to track asset condition is often difficult to manage. While there is no formalized standard for tracking this information, the Federal Transit Administration (FTA) has published Transit Asset Management (TAM) guidelines to help agencies organize and manage their data and produce TAM Plans that meet federal requirements.16 The TAM model recommends tracking a variety of attributes related to assets, such as age, expected life, general attributes, model, available parts, utilization, condition, defects, inspection dates, investment, and life cycle costs.
For small urban, rural, and tribal reporters, reporting on asset condition is often facilitated by other agencies, but tracking this data nonetheless falls to individual agencies. Asset information can readily be tracked in a spreadsheet or in a database, but many agencies will use purpose-built Decision Support Tools (DST) maintained by state or federal governments. The FTA provides a number of resources for agencies to produce TAM plans. These include a TAM Plan Excel template for small providers and a Microsoft Access-based tool called Transit Economic Requirements Model Lite (“TERM-Lite”) that is designed to help agencies track and forecast annual investments needed to maintain assets in a State of Good Repair (SGR).17 In addition, FTA provides specific assistance for tribal agencies through TAM for Tribes.18 This assistance outlines the requirements for reporting and the possibilities for sponsoring or joining a group for reporting requirements.
Tracking TAM data not only helps with maintenance and performance monitoring but can also help with both short-term operational needs and long-term strategic planning. This information can then be used by a variety of staff, including maintenance staff, accounting staff, or for budget and planning purposes.
Further methods of analyzing transit asset data are discussed in Chapter 4: Planning and Performance Monitoring.
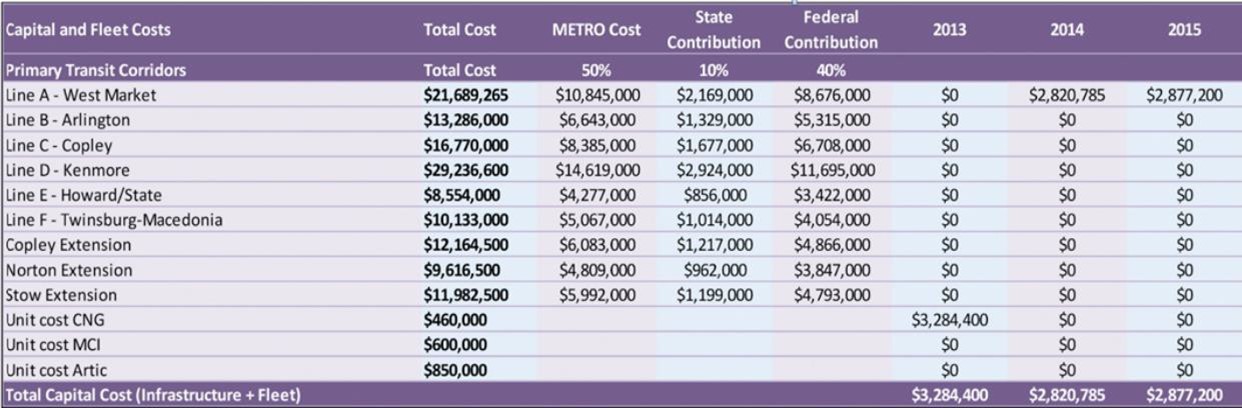
Figure 13: Example TAM Spreadsheet, Akron METRO Bus19
16 Federal Transit Administration. 2020. “Transit Asset Management.” Accessed January 20, 2021. View the reference document here (external link)
17 Federal Transit Administration. 2015. “TERM-Lite.” View the reference website here and here (external link)
18 Federal Transit Administration. 2020. “TAM for Tribes.” Accessed January 20, 2021. View the reference website here (external link)
19 Federal Transit Administration. March 2016. “Asset Management Guide for Small Providers.” FTA Repot No. 0092. View the reference document here (external link)
Ridership Data
For many small transit agencies, drivers wear many hats. In addition to safely operating the vehicle and providing excellent customer service to passengers, many must also keep track of ridership and fares. When ridership is tracked manually, it is important to have standards in how it is collected, formatted, and summarized. Ridership data collection on fixed-route services should use pre-populated, standard forms developed by the agency that include the scheduled trip start time, the vehicle used, and stop name and ID as relevant. Columns to record the number of passengers boarding and alighting (along with any special categories of passenger types to note) and the time each stop is departed should also be included. For systems with flag stops, popular boarding and alighting locations should be pre-listed with sufficient space before and after them for other boarding and alighting locations to be listed. Pre- populated forms reduce the likelihood that drivers make errors in recording stop locations or trip start times and allow them to focus on providing excellent customer service and safe trips for passengers.
When manually- collected data is entered electronically, each row should be a single stop location on a specific route and specific trip or vehicle to allow the data to easily be summarized at a later point at the stop, route, trip, or vehicle level. When using Microsoft Excel for ridership tracking, Pivot Tables are an easy function to transform raw ridership data into summary data at various levels. They can also be used for data quality control, for example, to make sure that the number of boardings and alightings on a single trip is balanced.
Internal Standards
While there may not be an existing industry standard for every type of data, an agency can create its own data standards for internally collected and managed data. A variety of considerations may be useful when designing data standards. First, consider who will use the data.
There may be multiple staff or departments who will use the same information for different purposes. Bringing these staff members together to discuss how they will use the data and what they need to be maintained in the dataset can ensure that the final product is usable for many purposes. Next, data can be formatted in a variety of ways. Decide on the unit of each record—what one row will represent—and assign identification variables to track each row. Decide how this dataset might relate to outside data sources and include relevant ID variables to allow for this. Since datasets are often used for reporting purposes, consider which attributes are necessary for reporting.
Finally, determine whether geospatial information (e.g., latitude and longitude) will be needed and how it will be collected or related to a dataset. If the dataset is collected over time, include columns that track the year, month, or day—this can help agencies understand changes in metrics over time. This allows agencies to track trends in ridership, bus speeds, or other metrics that provide valuable information on what types of service modifications could be needed in the future.
Guidelines for Choosing How to Store Your Data
| Consideration | Spreadsheet | Database |
| Number of individuals regularly entering or accessing data | One or two people | More than two people |
| Length of time data will need to be stored | One to two years | More than two years |
| Frequency with which data will be created | On an ad-hoc basis | On a regular basis |
| Volume of records created | Relatively few records (<1,000) | Relatively more records (more than about 1,000) |
| Consistency of data collected | Characteristics of data to be collected varies | Standard data variables are stored and collected |
| Technical ability of staff | Less experienced | More experienced |
| Relationships to other Datasets | Few or no relationships to other datasets | Many relationships to other datasets |
| Importance of data | Consequences for errors or data loss not severe | Data is critical to the agency |
The number of individuals regularly entering or accessing data.
The flexibility of spreadsheets can lead to informal data entry practices that may vary across individuals. Databases by default include more strict data validation requirements, such that a particular variable must always be a number or a date. Microsoft Access allows for both data entry forms and standardized reports that also help to facilitate its use by multiple individuals. Other databases can also limit who accesses data, log who has changed a record, and track when data has changed.
Length of time data will need to be stored.
The regularity enforced by databases can be an asset to agencies when data needs to be stored and accessed over a long period of time. This can help to minimize differences in data quality as the staff responsible for a dataset change. Suppose you expect only to need to refer to data for a short period of time (such as for a project or analysis of limited duration). In that case, a database may not be necessary.
Frequency with which data will be created.
Spreadsheets can quickly be created to support a data collection and reporting effort. If you expect to enter data regularly over time, it may be helpful to use a database to ensure consistency between entries.
Volume of records.
While spreadsheet tables can accommodate hundreds of columns and many individual rows, it is often impractical to edit individual records as the spreadsheet grows in size. Databases can more readily store gigabytes of data and often come with reporting tools that allow users to access relevant data quickly.
Consistency of data collected.
A spreadsheet’s flexibility is an advantage if you are beginning a data collection effort and are not yet sure what variables are important to collect or how they should be stored. Once the variables that will be tracked in a dataset are well understood, a database may be more useful. Some NoSQL or document databases like MongoDB are more flexible than typical relational databases when the types of information tracked about each record may vary.
Technical ability of staff.
Even user-friendly databases like Microsoft Access are more challenging to set up and maintain. If staff turnover is high, the cost to set up a database, only to see it abandoned, may be too high.
Relationships to other datasets.
Databases are especially well suited to relating tables through key fields. For instance, a table of route ridership by stop might be related to a separate table with information about those stops’ locations and characteristics, like whether a bus shelter is present.
Importance of data.
If your agency depends on this dataset for reporting to external agencies or partners, the rigor imposed by a database is very useful. If the loss of data would only result in some inconvenience, tracking your data with a spreadsheet may be sufficient.
Emerging Advances
While some data standards have been around for years, the field continues to develop new standards to collect and process new types of data. While GTFS provides a standard for fixed-route services, this format is being extended to provide the same level of access and visibility to flexible transit services.
Standards are also emerging to collect and share demand-response-generated data that can allow for greater coordination between demand-response providers. Greater use of GTFS leads to a need to check GTFS feeds’ validity to ensure that they are usable and accurate. As intelligent transportation systems (ITS) are used increasingly to automatically collect data about vehicle location, fares, and passengers, data standards are emerging to standardize the collection and processing of this data.
GTFS-Flex
Existing GTFS provides schedule data for fixed-route transit but does not provide information for flexible transit services, like demand-response or deviated fixed routes services. Users for whom fixed-route services are not preferable or an option also deserve to access information about transit services easily; this could include passengers with disabilities who need specialized paratransit services or rural residents who may have access to a demand-response service but no fixed-route services.20 GTFS-Flex is an extension of the GTFS format that addresses this need by adding booking rules, location groups, and locations and using an updated stop_times table.21 The extension aims to provide the same visibility and ease of use for flexible transit that GTFS provided for fixed-route services. More resources for using GTFS-Flex, including a white paper by N-CATT, are provided in the resources section at the end of this chapter.22
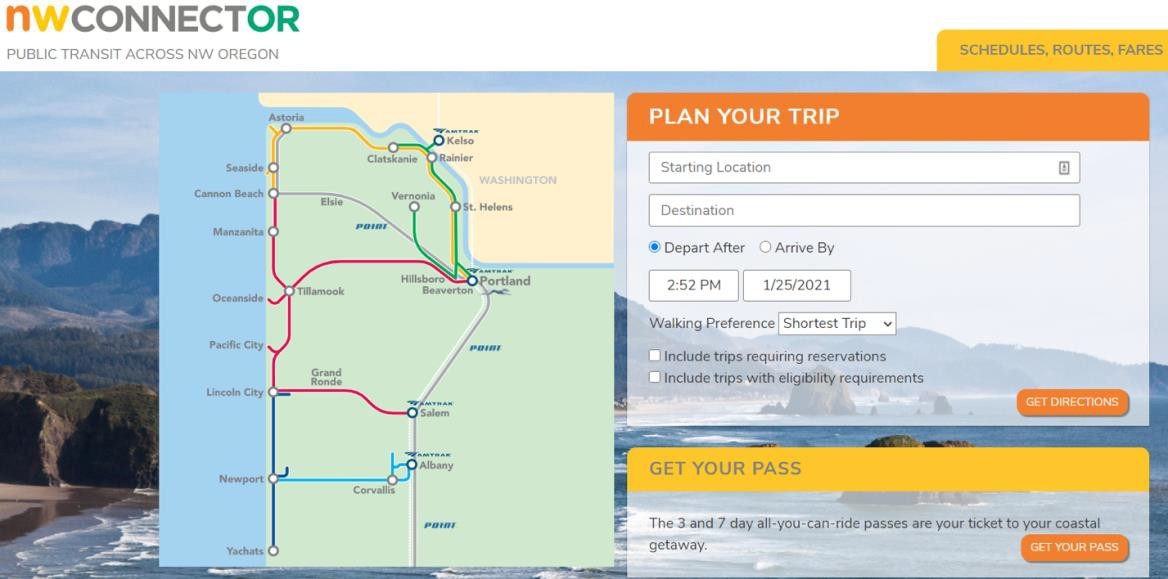
Over 100 transit services currently use GTFS-Flex, including: NW Connector, a partnership through five agencies in Oregon; Vamos Mobility, a partnership between 12 agencies in California, and Denver Regional Transportation District in Colorado. GTFS-Flex remains under development and is subject to change based on feedback from users. While Google Maps does not currently support GTFS-Flex, OpenTripPlanner supports several GTFS-Flex features, including: flag stops, which allows boarding and alighting between defined stops; deviated-route services, which allows a vehicle to deviate from its route within a defined radius; and call-and-ride services, which plans trips from origin to destination upon request.23
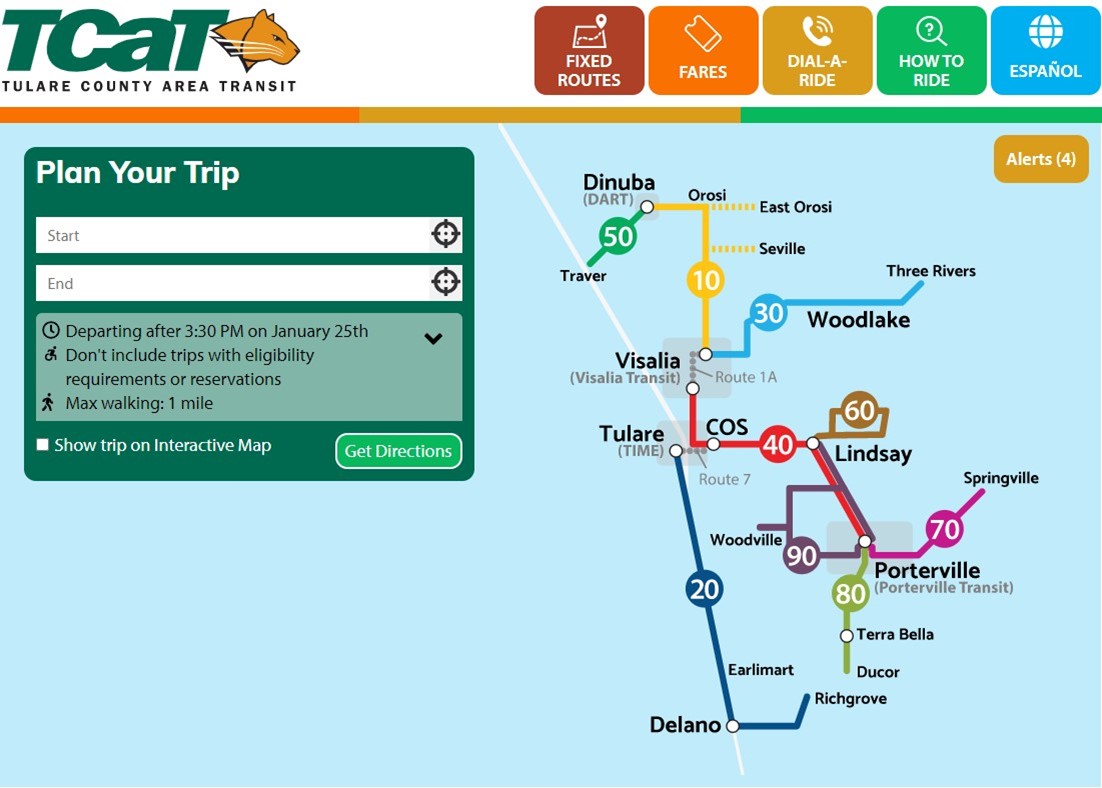
Tulare County GTFS-Flex
Tulare County Area Transit (TCaT), an agency providing transit services in Tulare County, California, offers a trip planner powered by GTFS-Flex. The trip planner enables riders to access information about both fixed-route and flexible, demand-response services. It also provides users with information about how to access demand-response services, including eligibility rules for demand-response trips, requirements for how to schedule a ride, estimated pickup and drop-off times, and fares.
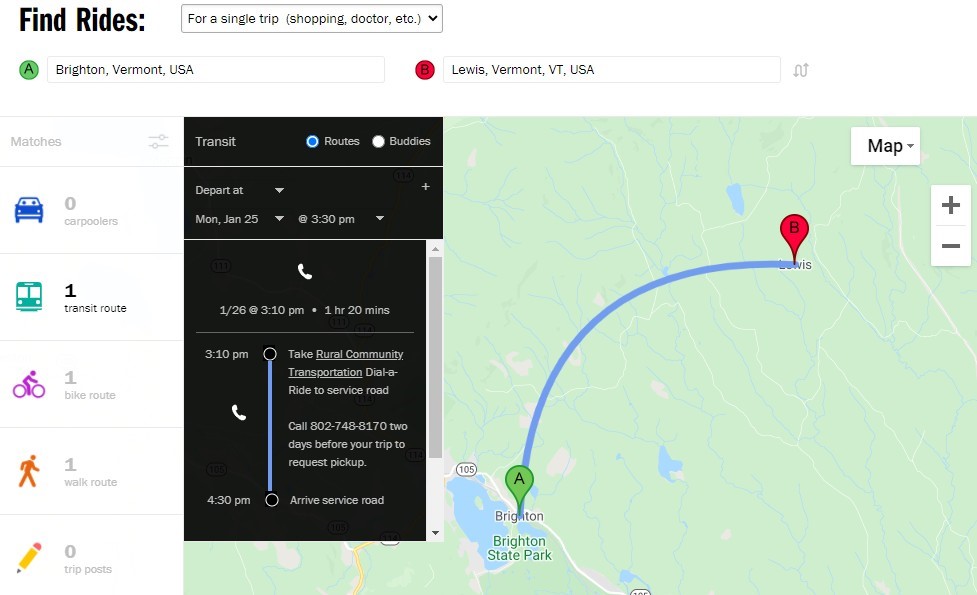
VTrans Statewide Trip Planner
The Vermont Agency of Transportation (VTrans) provides a statewide trip planner that uses GTFS-Flex to provide information about both fixed-route and flexible transit services. This trip planner was one of the first to use GTFS-Flex to combine multiple modes into a single trip planner. Combining modes allows the service to be used in any part of the state, which allowed nearly 100 percent of Vermont’s population to plan transit trips, up from around 50 percent before using GTFS-Flex. To achieve this, VTrans worked with software consultancy Trillium to use GTFS-Flex within OpenTripPlanner, which has since been incorporated into OpenTripPlanner. A second and third iteration of the VTrans trip planner plans to incorporate carpooling, vanpooling, taxis, airport shuttles, and other transportation options. The VTrans trip planner not only helps rural residents find transit services but also helps to connect residents with disabilities to the transit services they can use.
To learn more about Vermont’s GTFS Flex in Statewide Trip Planner , visit:
N- CATT’ s white paper “Open Source Software and Open Data – What They Are and How to Use Them.”
N- CATT’s “Promising Practices Guidebook: Transit Techno logy Adoption”
20 Thomas Craig. 2020. “GTFS-flex.” (Presentation, Trillium & Minnesota Public Transit Associatoin). View the reference document here (external link)
21 Github. “MobilityData / gtfs-flex.” Accessed January 20, 2021. View the reference website here (external link)
22 N-CATT. 2020. “GTFS Flex: What is it and How is it Used?” December. View the reference website here (external link)
23 OpenTripPlanner. n.d. “GTFS-Flex Routing.” Accessed January 20, 2021. View the reference website here (external link)
GTFS Validators
While GTFS tables are simple to produce, there are few built-in checks to prevent errors from being introduced into the feed. GTFS Validator tools can check feeds for errors that result in the feed not conforming to GTFS specifications. In addition, some tools will also check for inconsistencies in the data, like stops that are far away from the service area or routes with no trips listed. While not formatting errors, these inconsistencies can affect the accuracy of information provided in trip planners. There are several tools that help agencies check or validate their GTFS feeds. Google provides a transit feed validator and provides a list of other resources to validate GTFS feeds.24 Conveyal produces a GTFS validator that processes feeds faster than Google’s validator and conducts a different set of tests.25 Other feed validators are actively under development, including validators that assess GTFS-RT feeds’ quality and other GTFS extensions
Intelligent Transportation Systems (ITS) Standards
More and more small agencies are adopting intelligent transportation systems (ITS) that automatically track vehicle location (Automatic Vehicle Location, or AVL), count passengers (Automatic Passenger Count or APC), and collect fares (Automatic Fare Collection, or AFC). Of the three technologies, AVL is the most used by small agencies; in one survey, its use increased from six percent of survey respondents in 2010 to 51 percent in 2020.26
AVL is produced using sensor technology attached to vehicles. As discussed in Chapter One: Data Sources, combining it with other information like announcements and route patterns can provide useful secondary datasets. AVL can be used in concert with GTFS-RT to provide real-time information to customers. APC data is often collected through infrared screens on doors that can count both boardings and alightings and can often track location and time data. AFC generally accepts a variety of fare media and has the potential to replace APC data. In systems that use smart cards as fare payment, individuals’ trips can be tracked over time. Compared with surveys done by staff throughout the year, automatic ITS data is collected at all times of the day throughout the year on equipped vehicles.
There are a variety of ways to process this data after collecting it, which include processing in-house, using software provided by equipment vendors, or contracting with third-party software providers. The Transit Cooperative Research Program (TCRP) is currently conducting research about how to create data standards around collecting and processing ITS data.27 RouteMatch and Ridecheck Plus are two example products that can collect and parse ITS data. The key to using ITS data effectively is assigning IDs (for stops, trips, trip instances, block, service days, and vehicles) that match other datasets across the agency, including with GTFS. Matching IDs across datasets allows the agency to compare scheduled times to actual times and calculate on-time performance. In addition, reporting data with high granularity– at the route, stop, and trip instance level with trip IDs – allows an agency to examine the data at the route, stop, or trip level. It also allows for quality control checks to take place, such as balancing boardings and alightings on individual trips. Best practices for recording demand response data include recording coordinates for pickups and drop-offs, along with the trip start and end times and vehicle ID.
Collecting this data with a high degree of granularity—i.e., at the smallest unit possible—allows agencies more flexibility in extracting a variety of tables or reports from the data. Data at the stop or trip level can help identify popular stops requiring more boarding time or identifying common transfer points. From AVL data, an agency can calculate bus speeds along a route to identify particularly slow or fast travel segments. Combining the three data types can help agencies infer origin/destination pairs as well as popular transfer locations.
Once collected and processed, agencies can use this data for a variety of purposes, including service planning, performance monitoring, scheduling and operations, financial planning, customer information, and reporting. It can even be combined with non-transit data like traffic congestion, demographics, or economic data to understand how service is being used or provided. Although these applications are possible, in most small agencies, ITS data is more likely to be used for day-to-day operations rather than for longer-term planning applications and performance monitoring.28
24 Google. n.d. “Testing GTFS Feeds.” Transit APIs – Static Transit. Accessed January 21, 2021. View the reference website here (external link)
25 Github. n.d. “Conveyal / gtfs-lib.” Accessed January 21, 2021. View the reference website here (external link)
26 Del Peterson, Jeremy Mattson, Kenechukwu Ezekwem. 2020. “ITS Technology Usage and Feasibility in Small Urban and Rural Transit.” Fargo, ND: Small Urban and Rural Center on Mobility (SURTCOM 20-01).
27 TRB, “TCRP G-18”
28 TRB, “TCRP G-18”
Demand-Response Transit Transactional Data Specifications
Demand-response services are deployed on an individual basis, with each demand-response service either developing their own data communication methods or purchasing software to do it for them. This means that demand-response services cannot communicate with other shared services or collect and disseminate data in a standardized way. TCRP has published data standards that, if adopted, could make collecting, sharing, and coordinating data across demand-response service providers more seamless.29 They propose a transactional data specification in which a set of rules determine data collection and interactions between software systems. This method establishes a common language for tracking relevant demand response data and provides a recommended approach for how communication about data can occur between agencies or software systems. Implementing these standards could allow agencies to coordinate with one another to provide trips to customers, providing better services for customers, reducing wait times, and improving productivity. Standardized data formats would allow more flexibility in choosing a software provider and would also help produce reports.
29 National Academies of Sciences, Engineering, and Medicine. 2020. TCRP 210: Development of Transactional Data Specifications for Demand-Responsive Transportation. The National Academies Press. View the reference website here (external link)
Conclusion
Whether formal or informal, data standards can help an agency collect, structure, and process data to be easily usable.
What are your agency’ s informal data standards for practices without a standard that could be made standard-operating procedures?
Standards are ultimately a key determinant of what an agency, customer, or stakeholder can get out of the data. Formal data standards, such as GTFS, GTFS-RT, or GTFS-Flex, allow schedule data, real-time data, and demand-response data to be broadcast widely via Google Maps and other trip-planning applications. Emerging standards, such as transit asset management, allows an agency to track internal data like vehicle maintenance. In contrast, ITS systems and standards give agencies access to a large range of automatically generated data. Standards allow agencies to use open data sets published by other government agencies and private entities and allow for open data to be more readily published and used by others.
Checklist: What are your agency’s internal standards?
| Internal Standard | Currently Use This | Want to Prioritize This |
| ID variables used are consistent with other agency data sources | ||
| Staff from multiple departments contribute to the development and maintenance of the data | ||
| Dataset has all of the attributes necessary for reporting | ||
| Geospatial data is included | ||
| Year, month, or day data is included | ||
| Data conforms to external standards (as applicable) |
Key Resources on Data Standards
Visit: FTA’s Transit Asset Management Systems Handbook
Visit: FTA TAM Resources
Visit: Google’s GTFS Validators help page
Visit: Google’s GTFS-RT Overview
Visit: GTFS Best Practices
Visit: GTFS-Flex on GitHub
Visit: TCRP 210: Development of Transaction Data Specifications for Demand-Responsive Transportation (2020)
Visit: TCRP G-18: Improving Access and Management of ITS Data (pending publication)
Visit: RTAP GTFS Builder