Data Practices Chapter 3 – Open Data
- Date: February 18, 2022
Jump to section
As both data producers and data users, transit agencies can benefit from accessing external open datasets and by opening their own transit data to the public. Among many benefits, open data practices promote awareness of transit services, increase transparency, improve efficiencies, and spur innovations. Not all open data is created equal: useful open data depends on strong data collection, processing, and documentation to ensure data can be used effectively once published.
Challenges associated with providing open data often relate to resources and organizational limitations, data quality and timeliness, and technical issues.
Open data is data that can be freely used, re- used and redistributed by anyone— subject only, at most, to the requirement to attribute and share-alike. 30
A variety of open data sources are available to transit agencies to use themselves, often from regional or state agencies or other public data portals. Data from these sources can be used for a broad range of transit planning and geographic information systems (GIS) applications, including socioeconomic and travel demand analyses. While open data sources are easy to access, many of these datasets require collecting and analyzing large volumes of tabular or spatial data, which may lead agencies to seek technical assistance from cities, state DOTs, or private consultants.
Open Data and ‘ Free – to- Use’ Data Sources
Benefits and Challenges
Decisions around open transit data must weigh benefits against the challenges in opening data at small transit agencies. However, findings show that the benefits of opening route and schedule data in standardized formats, and vehicle locations when possible, clearly outweigh any risks and efforts in overcoming challenges.
Open Data Sources
Open data sources are available to transit agencies directly from regional or state agencies or across the web on government websites and public data portals. These include socioeconomic data from the U.S. Census, Census’s LEHD/LODES data, and spatial data such as TIGER/Line and OpenStreetMap.
Emerging Advances
Web Tools to Obtainand Visualize External Open Data
A number of websites and free-to-use applications allow users to download, view, or visualize open data created by the Census Bureau and other sources, including Census Reporter, Policy Map’s Open Map, On the Map, CTPP Data Viewer, Remix, Google’s MyMap, and RTAP applications.
New Data Sources
New data sources, including location data from smartphones, data from trip planning and fare payment apps or mobility-as-a-service (MaaS) apps, and data from new mobility options, such as shared scooters and bicycles and transportation network companies (TNCs), can provide additional insight into how people move around their communities.
Introduction
As both data producers and data users, transit agencies can benefit from accessing external open datasets and by opening their own transit data to the public. Accessing external datasets can help agencies serve their community and operate efficiently, while sharing internal datasets can bring benefits ranging from improved customer information to improved performance. In this context, this chapter aims to help agencies make decisions about opening transit agency data and accessing external datasets.
From Census tools and datasets to local government data portals, agencies already have a bounty of open data at their fingertips. Open data refers to openly accessible repositories of data collected by government agencies or made available by private entities with a permissive license. In addition to being freely accessible, data is open if it can be used, modified, and shared by anyone for any purpose—subject only, at most, to requirements to provide attribution and/or share-alike.31 Several ‘free-to-use’ data sources may have restrictions on how the data is used or how much can be obtained and so are not open data but may still be available to use. Transit agencies may also access data through sharing agreements and partnerships, further discussed in Chapter Five: Partnerships.
N- CATT’ s white paper “Open Source Software and Open Data – What They Are and How to Use Them,” published in Oc tober 2020 , explores the characteristics, benefi ts, and challenges of open transit data, as well as what open- source software and open data each can and cannot deliver for transit systems in rural, tribal, and small urban areas. As a complement to the white paper, this chapter dives deeper into how agencies can also take advantage of other open data sources.
Either manually-collected or passively-generated, and whether following a standard or not, the data generated by transit agencies is vast. An agency recipient or subrecipient of Federal Transit Administration (FTA) Chapter 53 funds collects and reports annual data on the types of services provided, operating data, and asset conditions, among other data elements. Demand-response providers keep a database of trips. By publishing a General Transit Feed Specification (GTFS) feed, an agency shares standardized data on the location of bus stops, schedules, and more. An agency with a fleet equipped with automatic passenger counting (APC), automatic vehicle location (AVL), or automatic fare collection (AFC) technologies generates data useful for operational activities. Though all these data examples fall under the umbrella of transit data, the most impactful open transit data is shared in a standardized, machine-readable format.
There are costs and a level of effort involved in opening and maintaining updated datasets. Effective open transit data depends on good internal data management and may require changes to data collection, data processing, and data documentation to ensure data accuracy. Many small transit agencies operate with limited personnel and lack dedicated staff or divisions responsible for data collection and management.
Despite the challenges, those processes may yield benefits from simplifying agency workflows to producing better performance statistics.
30 Open Data Handbook. n.d. “What is Open Data?” View the reference website here (external link)
31 Open Data Handbook. n.d. “Glossary: Open Data.” View the reference website here (external link)
State of the Practice
A range of potential benefits motivate agencies to open their transit data and consume open data, though agencies must consider the risks, challenges, and costs (including staff hours) of doing so. Issues around open data legislation and data privacy also underly these decisions. This section covers some observed benefits of open transit data and discusses aspects of opening transit data and consuming open data.
Benefits of Open Transit Data
There are many beneficiaries of open transit data practices, from individual transit agencies to customers to third-party developers to the transit industry as a whole. Open data practices lead agencies to promote service awareness and transparency, improve efficiencies, and foster improved relationships with data stakeholders. By delivering data through customer-facing applications, transit agencies can improve customer satisfaction, become more engaged with customers, and improve service and data quality.32 Lastly, third-party developers, who typically rely on transit agency-provided data, can continue to spur innovations and establish themselves as links between transit services and customers. For these reasons, the transit industry has continued to push for the development of data standards, as discussed in Chapter Two: Data Standards.
Agency Benefits
Increased awareness of the available transit services is one of the most common benefits agencies experience as a result of providing open data.33 Given trends in government transparency enabled by web technologies, the general public increasingly expects transit providers to publish data in free-to-use and open formats.34 Beyond improving public perception and providing a sense of transparency, agencies that provide standardized, open transit data increase awareness of their transit services. Open transit data can serve to publicize available transit services to existing and potential new customers. The higher quality transit information results in improved customer service and experience and potentially increased ridership.
Central to many open data initiatives is the commitment to customers and their needs. To address these, agencies embraced a continuous process of improvement of the data shared and services offered. By releasing more customer-oriented transit data, many agencies face lower costs associated with customer requests, among other efficiencies. More often than not, open data initiatives also streamline data collection and management practices at transit agencies. These realizations illustrate the efficiencies and potential savings associated with open data.
Open transit data encourages innovation outside agency walls that can ultimately benefit the agency in turn. Private developers have responded to open streams of public transit route, schedule, and vehicle data by developing travel apps that provide trip planning and vehicle arrival information to customers. This allows agencies to extend their reach to existing and potential customers through applications without having to invest in software application development. Additionally, by opening up data, transit agencies can identify problems with datasets more easily through feedback from external users of the data.
32 Federal Transit Administration. 2016. FTA Open Data Policy Guidelines. Washington, DC: FTA Report No. 0095. View the reference document here (external link)
33 National Academies of Sciences, Engineering, and Medicine. 2015. TCRP Synthesis 115 Open Data: Challenges and Opportunities for Transit Agencies. Washington, DC: The National Academies Press. View the reference website here (external link)
34 National Academies of Sciences, Engineering, and Medicine. 2020. TCRP Report 213: Data Sharing Guidance for Public Transit Agencies Now and in the Future. Washington, DC: The National Academies Press. View the reference website here (external link)
Customer Benefits
One of the most significant benefits that transit agencies consider when publishing open transit data is its potential to impact customers positively. Almost 90 percent of transit agencies in a recent TCRP survey release route, schedule, and vehicle location data in order to provide customers with more information.35 These open data feeds provide customers with greater certainty about their journeys and potentially save passengers time resulting in improved customer satisfaction and even inducing higher ridership.
Almost 90 percent of transit agencies in a recent TCRP survey release route, schedule, and vehicle location da ta in order to provide customers with more information.
Open data policies and practices can also create a conduit for agency and customer interaction, improving customer relations. For example, through open data activities, agencies can engage customers with satisfaction surveys, and by tracking application downloads and the number of times real-time data feeds are accessed. Application and customer satisfaction evaluations, application tracking, and continuous improvement processes associated with open data practices orient the agency toward engaging with its customers and recognizing their experiences.36
Third-Party Developers
In addition to transit agencies and transit customers, third-party developers are crucial players who use transit agencies’ data to create innovative products and tools for the public. Private companies offering trip-planning apps increasingly serve as de facto front ends for transit agencies.37 Serving customers in ways agencies may not be capable of doing, these companies commonly invest significant resources into improving transit data to conform to quality standards and add new features to the dataset to meet the rider’s expectations. Beyond mobile applications, developers also use multiple operational and service data to create innovative practices in service planning, operations, and maintenance, among others.38
35 National Academies of Sciences, Engineering, and Medicine. “TCRP Synthesis 115.”
36 FTA. “Open Data Policy Guidelines.”
37 Transit Center. 2018. “The Data Transit Riders Want: A Shared Agenda for Public Agencies and Transit Application Developers.” View the reference website here (external link)
38 FTA. “Open Data Policy Guidelines.”
Publishing Open Transit Data
Challenges
Decisions around open transit data must weigh benefits against the risks in opening data while considering the challenges in doing so. Figure 17 indicates the potential benefits and risks of sharing several transit passenger and system datasets.39 Passenger data include passenger count data and survey data as well as newer data types, such as fare or bank card transactions, video, Wi-Fi, Bluetooth, and app and webpage usage data. Most types of passenger data contain records of individual passengers or records that have the potential to identify an individual, posing a privacy risk. Data about the transit system includes route and schedule data, vehicle location data, maintenance, staff and operations data, and financial data. Risks related to these datasets typically do not contain privacy risks, and for routes and schedules and vehicle locations, the benefits are generally considered to always outweigh the risks.
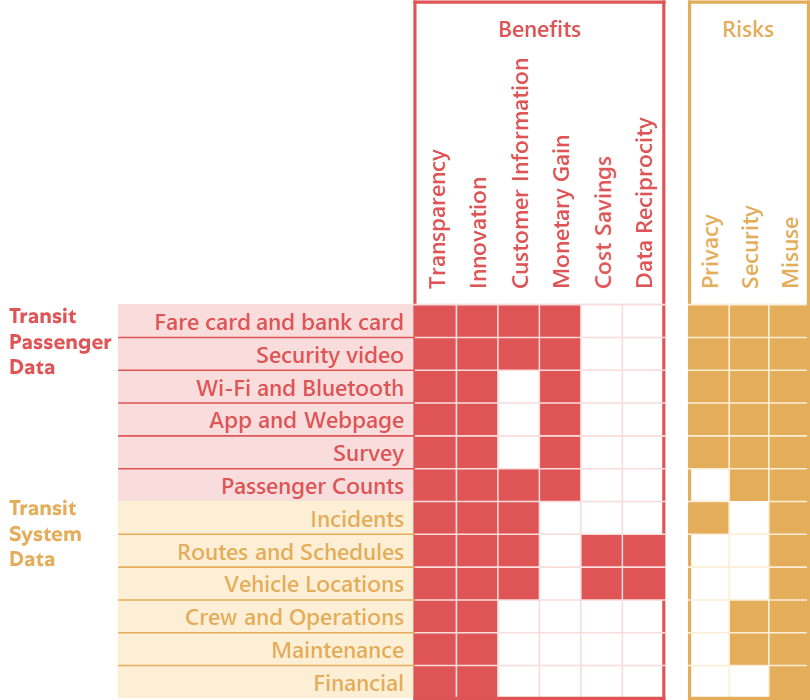
39 Source: Adapted from TCRP Report 213: Data Sharing Guidance for Public Transit Agencies—Now and in the Future (2020).
Effective open data depends on good internal data management, which may require changes to data collection, data processing, and data documentation to ensure data is used effectively and appropriately when published. Considering the range of transit datasets, publishing some types of transit data can be resource-intensive and both technically and organizationally challenging for some transit agencies.
Challenges associated with providing open data often relate to resources and organizational limitations, data quality and timeliness, and technical issues.40
There are many steps required to prepare data for being published. These steps require staff time and may also require contracting with external vendors, in some cases. Often data is collected without analysis or sharing in mind, stored across different locations and systems, and not documented for external use. These data silos present challenges for both the internal and public use of the data. Good internal data management practices make data sharing easier. A well-documented, centralized internal data repository, for example, helps transit agency staff make use of data and reduces steps required to distribute data but may require dedicated staff time to develop and maintain it.41
Personnel and organizational demands, particularly in small transit agencies, also have consequences for open data sharing. Developing technical capabilities among transit agency staff requires staff training, and the additional challenge of staff turnover can make it difficult to ensure that progress in data management is sustainable. Establishing a staff member or team that is dedicated to data management is an important step in addressing challenges in opening transit data.
Technical limitations related to data collection influence the types of data, the data quality, and coverage available to be shared. While large transit agencies generally have full coverage of AVL systems in their vehicle fleets, GPS polling rates and accuracy vary from one implementation to another. Additionally, vendors that install and maintain systems, such as AFC, APC, or AVL, may retain ownership of the data generated, offer limited data reports, or export data in standards particular to the vendor. Although there has been a shift in ownership of AVL and AFC systems to transit agencies and standardization in real- time service/vehicle location, this issue may still persist for other data types. For example, if maintenance is outsourced, some maintenance data may be owned by the maintenance company rather than the transit agency.42
How to Successfully Open Your Data
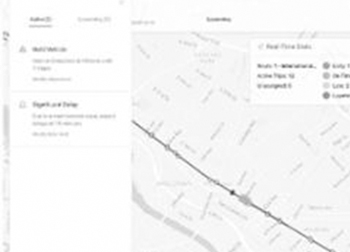
Route and schedule information, system alerts, and the real-time location of transit vehicles are often the first pieces of data that come to mind when discussing open transit data. In most cases, route and schedule information is published in the standard GTFS and GTFS- related formats, such as GTFS-Flex and GFTS-RT. However, agencies commonly publish information on performance indicators, including route or line-level ridership, passenger counts at bus stops and train stations, on-time performance, and reliability indicators. Transit agencies also provide summaries of survey data, including travel surveys and customer satisfaction surveys.
An Application Programming Interface ( API) is a way computer programs can talk to one another. APIs used to publish data a llow programmers to choose specific records they need and are authorized to view. The API is often l inked to a database that i s updated periodically. 43
Transit data can be made public in many forms. Agencies have maps, data, and reports that can be downloaded from their websites. Interactive dashboards allow customers to interact with the data in a controlled way. GTFS feeds can be available online for download. Among other kinds of data, route, schedule, and vehicle location data can be shared using an Application Programming Interface (API). These formats have advantages and disadvantages, as shown in Figure 18.44
40 TCRP Synthesis 115 Open Data: Challenges and Opportunities for Transit Agencies.
41 TCRP Report 213: Data Sharing Guidance for Public Transit Agencies Now and in the Future.
42 TCRP Report 213: Data Sharing Guidance for Public Transit Agencies Now and in the Future.
43 Open Data Handbook. n.d. How to Open up Data.
44 TCRP Report 213: Data Sharing Guidance for Public Transit Agencies Now and in the Future.
Figure 18: Methods for Sharing Data Online
| Static Reports | Interactive Dashboards | Data Repositories | Developer APIs |
| Accessible to all audiences
Protect against misinterpretation of data |
All audiences can interact with the data | Researchers and innovators can download and manipulate, generating new analysis and insights | Developers can efficiently pull data into apps |
| Data cannot be manipulated | If underlying data is not downloadable, data manipulation is limited
Dashboards require significant effort to develop |
Can be difficult to use for non- technical audiences
Risk of data misuse Not appropriate for disaggregated data on individuals |
Only appropriate for data sources that many developers want to access at frequent intervals
Difficult for non- technical users |
| Increasing interactivity > > |
Source: Adapted from TCRP Report 213: Data Sharing Guidance for Public Transit Agencies—Now and in the Future (2020).
High-quality transit data begins with the public agencies that produce and publish the data. Agency leadership is responsible for ensuring that potential customers can access the information they need to make transit their preferred choice.45 FTA’s Open Data Policy Guidelines Report lists several guiding principles and techniques for transit agencies to open transit data based on agencies’ insights that have successfully moved data into the open arena. These are:
- Follow best practices: Lessons learned from agencies regarding practices, procedures, and experiences are brought to light through workshops, webinars, interviews, and research.
- Embrace an altered perspective: View information and data systems as tools to improve decision- making and expand the influence over customer experience instead of overhead expenses.
- Become data-centered: Many agencies that embrace open data practices do so because it is part of an ongoing business enterprise that requires updating and curation.
- Focus on the customer: This customer focus is at the core of the mission of open data within the transit industry.
- Implement successful strategies: For agencies that have the support of staff and leadership, the implementation strategies guide them towards more improved open data programs.
- Develop an open data policy: A formal open data policy can guide the decision-making process, including procurement and technology considerations.
- Adopt a phased approach: When leaders are skeptical, and a formal open data policy is not politically palatable, agency staff may find success through pilot projects.
- Overcome technology barriers: Developing the skills within the organization to manage, create, and distribute the data, to outsource the responsibility for data management, or create a blended approach as is typical for most agencies.
- Engage with data users: Agencies that successfully share their data often have a relationship with the main data stakeholders.
- Overcome fear of hazards: Several factors contribute to agencies maintaining a closed data position, including loss of control over data and data quality and fear of legal hazards of open data.
A step-by-step process for publishing open transit data is provided below.
I want to open transit data 46
45 Transit Center. The Data Transit Riders Want: A Shared Agenda for Public Agencies and Transit Application Developers.
46 Adapted from Let’s Open Some Government Data! n.d. “Yeah, I want to open transit data.” View the reference website here (external link)
I want to open transit data 46
Using Open Data
Open data sources are available to transit agencies directly from regional or state agencies or from other public data portals. Data from these sources can be used for a broad range of transit planning and geographic information systems (GIS) applications, including socioeconomic and travel demand analyses. While open data sources are easy to access, many of these datasets require collecting and analyzing large volumes of tabular or spatial data, which may lead agencies to seek technical assistance from cities, Metropolitan Planning Organizations (MPOs), state DOTs, or private consultants.
Socioeconomic Data
Socioeconomic data is publicly available from the U.S. Census, including demographic and employment information for all states and territories at high levels of detail. The most complete datasets come from the decennial Census conducted every ten years, but the Census Bureau offers a large suite of free-to-use data products that are updated more often and cater to specific data topics. Central to many Census datasets is the American Community Survey (ACS), which collects an annual sample of population information, including counts by age, race and ethnicity, income, health, education, employment, and other household characteristics. Employment data is compiled into the Longitudinal Employer-Household Dynamics (LEHD) dataset, which provides details on industries, earnings, job growth, education, commute information, and other employment characteristics. Each of these Census products offers data as tables, with geographic identifiers associated with each piece of data. Census data can be downloaded for geographies as large as states and regions or as small as city blocks. The uses of socioeconomic data for access analyses are discussed in Chapter Six: .
How to use shared or open data to design a service to attract more riders 47
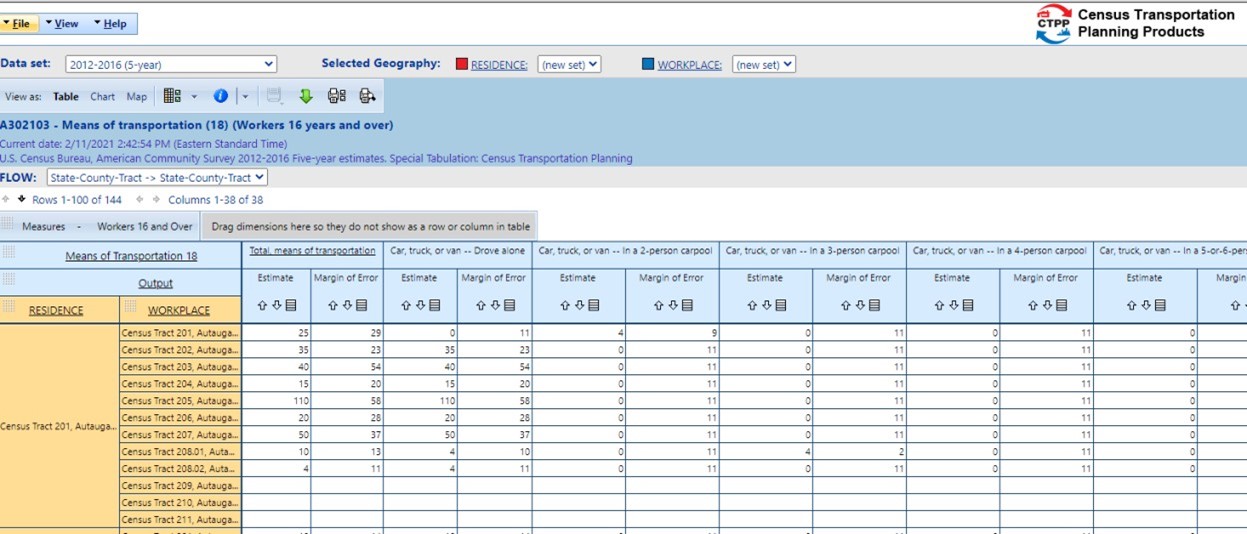
Transportation Data
Transit agencies can also take advantage of open transportation data, typically made available by governmental or other regional transportation agencies. This type of data includes travel volumes and commute patterns between origins and destinations and is often inferred from Census data or estimated using a travel demand model. The Census Bureau provides the Census Transportation Planning
Products (CTPP) dataset based on survey questions about Americans’ places of work. CTPP data can be analyzed to evaluate the origin, destination, duration, and mode of commute trips, also known as journey- to-work trips. LEHD Origin-Destination Employment Statistics (LODES) offer an alternative source of commute data based on the LEHD dataset, showing both home and work locations paired together.
Beyond the journey to work, many state and metropolitan area planning bodies maintain a regional travel demand model of all trips. These travel demand matrices provide a vast dataset of every origin- destination pair within the region and can be used to analyze travel patterns by trip purpose, time of day, and mode. Agencies can access travel demand data online or by direct request from the planning organization.
Transit data is publicly available through the National Transit Database (NTD) and other transit agency websites. NTD’s standardized data across agencies make it easy to use for cross-agency studies. Transit agencies can access data from NTD to compare ridership, service hours and miles, or other metrics to similar agencies across the country or to understand trends in public transit performance. For a more detailed analysis of another agency’s scheduled services, GTFS data can also be accessed from agencies that publish their GTFS feed online.
Spatial Data
Many socio-economic and transportation datasets have spatial attributes that allow for mapping and geospatial analysis with GIS software. These spatial attributes are often provided as point coordinates or a numeric identifier for the state, county, or zone associated with the data. Spatial datasets in various spatial data types can be found from numerous sources online, including both government-produced and crowdsourced datasets. Some spatial datasets include:
- Topologically Integrated Geographic Encoding and Referencing (TIGER) or TIGER/Line are geodatabases used by the U.S. Census to describe land attributes such as roads, buildings, rivers, and lakes, as well as Census tracts. TIGER shapefiles do not include the Census demographic data but contain geographic entity codes (GEOIDs) that can be used to merge Census demographics.48
- OpenStreetMap (OSM) is a collaborative project to create a free-to-use editable map of the world, with data quality comparable to proprietary data sources in many places. Extracts of OSM data can be used for geospatial analyses and route planning, among other uses.
- Points of Interest Data, such as activity centers identified through searches on Google Maps, can be downloaded using browser-based scraping tools without having to write codes or download special software. They are also available through organizations like Policy Map (see Emerging Advances section).
- Land use and other spatial datasets from public agencies are downloadable from government data portals, including spatial datasets of transit routes from other nearby agencies.
Analysis Skills
Desirable data and GIS analysis skills to take full advantage of open data sources may not be available for many rural and small transit providers that lack the resources (both in terms of time and staff) necessary to conduct advanced data analysis related to transit planning. With limited funding, agencies also struggle to hire data-savvy staff who can appropriately leverage the data that agencies can access and generate. A rural transit program that is part of a local government entity or regional planning organization is likely to have at least periodic access to GIS mapping and data services through its planning department. On the other hand, private non-profit entities are less likely to have this capability available in-house.49 GIS analysis, for example, may only be feasible as part of a larger planning project conducted by a consulting firm, a regional planning organization conducting a Transit Development Plan, or a local public transit-human service transportation coordination study. Open-source programs like Google Earth allow users to create basic GIS route and stop alignments, and can be used in applications like the RTAP GTFS Builder (see case study in Chapter Two: Data Standards). Other web-based tools detailed in the Emerging Advances section allow for some spatial analysis of things like ACS and LEHD data, or points of interest.
47 The National Academies of Sciences, Engineering, and Medicine. 2017. NCHRP Research Report 861 Best Practices in Rural Regional Mobility. Washington, DC: The National Academies Press. View the reference website here (external link)
48 U.S. Census Bureau. 2020. TIGER/Line Shapefiles. View the reference website here (external link)
49 The National Academies of Sciences, Engineering, and Medicine. 2012. Data Needs for Assessing Rural Transit Needs, Benefits, and Levels of Service. View the reference website here (external link)
Emerging Advances
Web Tools to Obtain and Visualize External Open Data
A number of websites and applications allow users to download, view, or visualize open data created by the Census Bureau and other sources. These applications are free-to-use and generally accompany tutorials or user guides to help first-time users navigate them. Applications built for Census data are the most common and include the following.
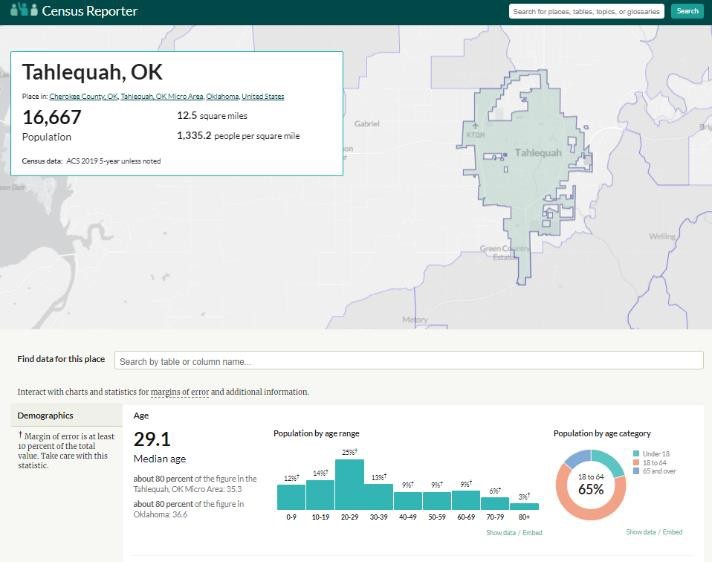
Census Reporter allows users to view and download ACS data for all available geographies. Users can start by entering the name of the geography or topic they wish to explore or by clicking on pre- populated lists of topics. Data can be visualized in interactive maps in the interface and also downloaded to be used in spreadsheets.
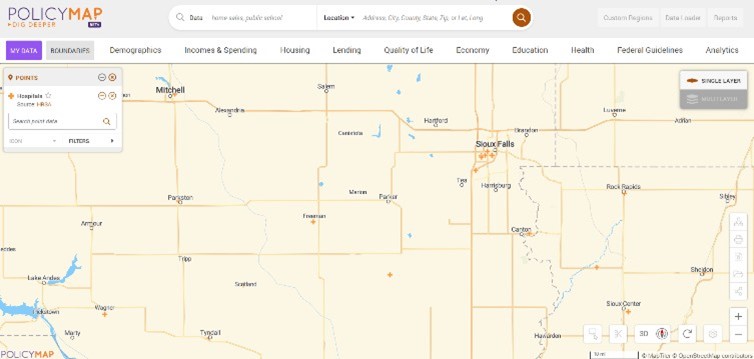
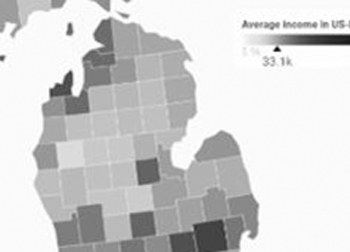
Policy Map has an Open Map interface that allows users to explore data on demographics, housing, quality of life, and healthcare (among other statistics) in an interactive map interface. While much of the available data is based on the ACS, this application can also provide agencies with the locations of important destinations such as hospitals and grocery stores and zones like Rural Food Access Investment Areas so agencies can plan services accordingly. The information available has been compiled from numerous research and policy organizations around the country.
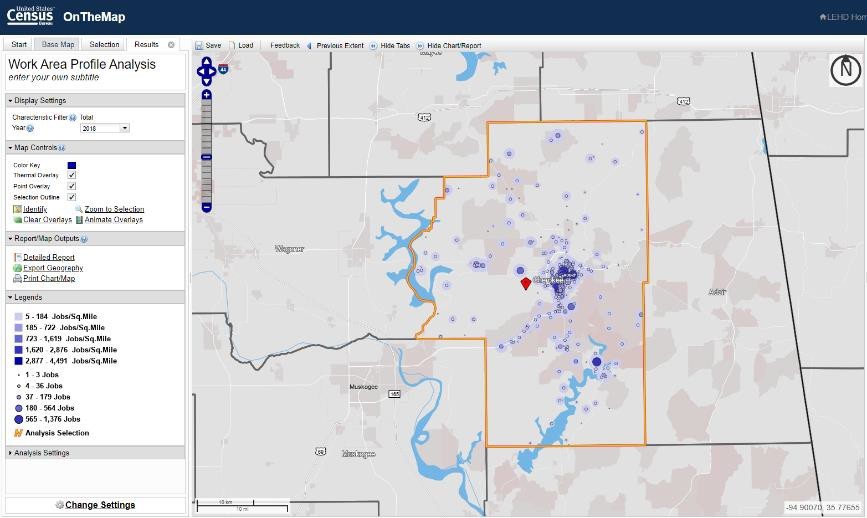
OnTheMap allows users to explore LEHD/LODES data. Employment data can be viewed for specific geographies based on where jobs are located or where workers in that geography live and as home to workflows between geographies. Users can view data in the interface or download data in spreadsheet format or spatial format, including for use in Google Earth. Data can also be viewed in the interface in various types of charts that can be downloaded.
CTPP data can be explored in a user interface maintained by the American Association of State Highway and Transportation Officials (AASHTO). Users can select residence and workplace locations, and view home-to-work travel flows between them, sliced by various ACS demographic characteristics such as mode used and travel time to work. The data can be displayed in interactive tables or maps and downloaded for additional analysis.
In addition to Census-based applications that help agencies better understand their service areas and customer bases, other web applications can help agencies with service planning and other tasks. Remix, for example, is a web application that lets transit agencies easily plan routes. MyMaps is a Google web application for map creation that allows users to upload tabular data (in CSV, XLSX, and GPX formats) and spatial files (in KML format) for easy geocoding, distance measuring, and map creation. The Rural Transit Assistance Program (RTAP) offers a series of free web-based applications that include a cost allocation calculator, a GTFS builder, FTA procurement procedures guidance, and a website builder.
New Data Sources
Transit is part of a multimodal transportation system. New data sources, including location data from smartphones, data from trip planning and fare payment apps or mobility-as-a-service (MaaS) apps, and data from new mobility options, such as shared scooters and bicycles and transportation network companies (TNCs), can provide additional insight into how people move around their communities. These datasets can serve many uses, including: helping evaluate overall demand patterns; providing more detailed road speed data to inform bus operations, route alignment decisions, improve bus arrival predictions; and identifying first and last-mile transportation modes and distances.50
Data sharing is often critical to building a well-functioning multi-modal transportation network. Partnerships for service provision across modes and with private mobility providers can be facilitated and often require some degree of data sharing. Some public transit agencies have also been working with cities and states to develop and push for regulations to facilitate access to external data streams. In this context, many cities have begun regulating and managing private mobility companies that operate on their public right of way, notably micromobility options. However, a small micromobility or TNC user base can make those datasets less valuable for drawing many conclusions.
Although micromobility or TNC usage may be limited in smaller metropolitan areas and rural areas, cellphone, location-based services, and GPS trace data can be useful for some smaller transit agencies. Cellphone connection data is collected by cellular service companies, while smartphone apps that use users’ locations collect location-based services data. Some companies even infer a user’s travel mode, helping agencies understand characteristics of alternate modes and demand patterns on alternate modes. These data sources are usually aggregated by analytics companies who derive and sell speed and origin-destination insights. Although generally not open or free-to-use, these data sources might be available to small transit providers through state DOTs or partnerships designed to be replicated in small metropolitan areas.51
50 TCRP Report 213: Data Sharing Guidance for Public Transit Agencies Now and in the Future.
51 The National Academies of Sciences, Engineering, and Medicine. 2017. Dubuque Smarter Travel Project. View the reference website here (external link)
Conclusion
Advances in data sources, data standards, and open data and tools can help transit agencies generate more value from their data and external datasets. Transit agencies need to set goals that can be accomplished through open transit data and data analysis and develop staff capabilities and data management processes to work toward those goals. Promoting a culture of open data and data analysis should be a long-term commitment for transit agencies that involves:
- The funding and prioritization of new technologies, data sources, and data analysis at the leadership level
- Training and acquiring qualified employees who have the skills to analyze data at the staff level.
Checklist: What are your agency’s open data needs?
| Staffing and Data Needs | Is a Current Need | Want to Prioritize This |
| Dedicated staff person or division focused on data management | ||
| Staff with data administration and maintenance skills, including an understanding of security and permissions | ||
| Staff with data analytics, including the ability to use scripts to automate data analysis processes and work with large datasets | ||
| Agency has a data catalog | ||
| Agency has data-sharing protocols in place | ||
| Agency has an open data preparation needs checklist |
What Exactly Do We Mean By “Using Data?”
Whereas obtaining data is the first step in any data practice, an analysis that leads to useful conclusions about data is the end result. For this Guidebook, data analysis is the practice of working with data for visualization, modeling, or communication about data that informs decision-making. The first section of the Data Practices Guidebook spoke to the ways agencies collect, manage, and share data, while the final section of the Guidebook shows how agencies are using data for planning and performance monitoring, for building new partnerships, and for analyzing system use for their transit systems.
Conventional data analysis practices include loading, cleaning, and visualizing data in Excel and reporting in other documents. Even if your agency does not have access to GIS software, online tools like Data Wrapper or Google MyMaps can help you create maps in a web browser, while Google Earth Pro is an easy-to-use substitute for viewing geographic layers found in many open data portals. Though quantitative analysis of spatial data is not readily performed with these tools, visualizing distributions of data on a map are the start of many spatial data analyses.
Examples of User-Friendly Tools for Data Analysis:

Automatic or passive data sources are complex and large in size, requiring new tools and techniques to use. While vendors of APC and AVL devices offer their own tools to extract and report data, larger agencies may rely on third-party tools to store and analyze data. Large agencies increasingly rely on data warehouses or data lakes to store raw or cleaned data in a way that can be more readily analyzed using third-party applications like Ridecheck Plus or Swiftly, processed with statistical programming languages like Python or R, or visualized with business intelligence (BI) software like Tableau or Microsoft PowerBI.
Tools for Analyzing Larger, Complex Datasets:

Regardless of the data source or method, determining the proper question to ask of the data is key. This Guidebook will show how agencies large and small have addressed questions through data analysis.