Data Literacy Initiative

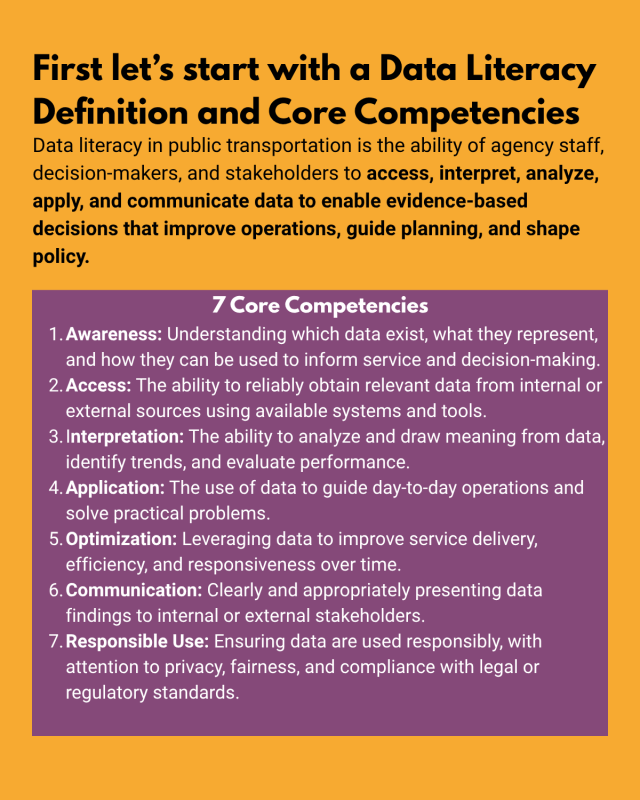
The Home of N-CATT’s Data Literacy. The initiative will help rural, tribal, and small-urban transit organizations maximize their data management, data storage, and data-based decision-making skills. Data is a vital and necessary tool for transit agencies, and this new initiative aims to help create digestible, easy-to-implement tools and resources for smaller agencies.  Effective data use helps transit agencies better serve riders through evidence-based decisions to support their service. The digital divide between large and small agencies is keenly felt when it comes to data and the staffing capacity to help manage data requirements.

The center will:

Want to see what N-CATT found out about through the survey:
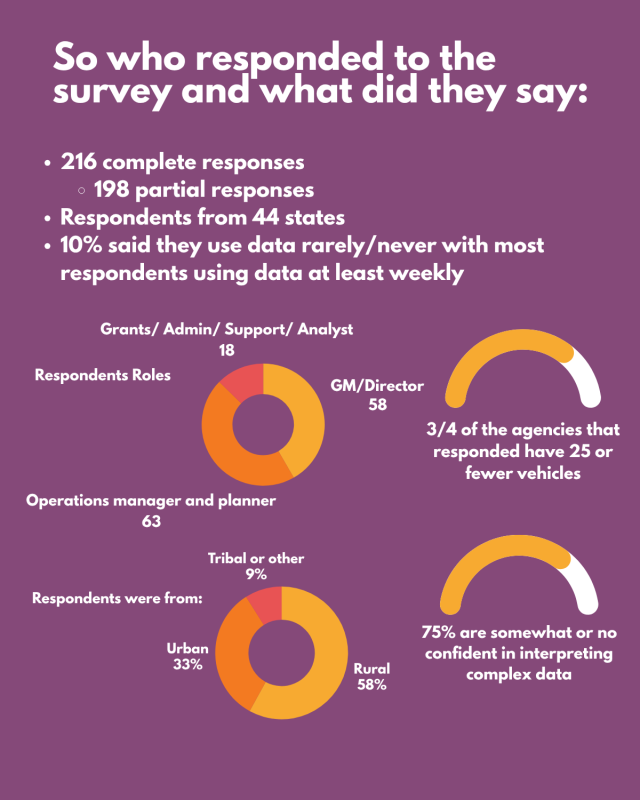
First let’s start with a Data Literacy Definition and Core Competencies : Data literacy in public transportation is the ability of agency staff, decision-makers, and stakeholders to access, interpret, analyze, apply, and communicate data to enable evidence-based decisions that improve operations, guide planning, and shape policy. 7 Core Competencies Awareness: Understanding which data exist, what they represent, and how they can be used to inform service and decision-making. Access: The ability to reliably obtain relevant data from internal or external sources using available systems and tools. Interpretation: The ability to analyze and draw meaning from data, identify trends, and evaluate performance. Application: The use of data to guide day-to-day operations and solve practical problems. Optimization: Leveraging data to improve service delivery, efficiency, and responsiveness over time. Communication: Clearly and appropriately presenting data findings to internal or external stakeholders. Responsible Use: Ensuring data are used responsibly, with attention to privacy, fairness, and compliance with legal or regulatory standards. So who responded to the survey and what did they say:
216 complete responses 
198 partial responses
Respondents from 44 states
10% said they use data rarely/never with most respondents using data at least weekly
Pie Chart showing respondents' roles: GM/Director 58, Operations manager  and planner 63, Grants/ Admin/ Support/ Analyst 18. 
Pie Chart Respondents were from: 9% Tribal and other, 33% Urban, 58% Rural.
3/4 of the agencies that responded have 25 or fewer vehicles.
75% are somewhat or no confident in interpreting complex data.

Check out the Results Powerpoint here!

Check out the New N-CATT Data Resources here: