On Demand Transit and Microtransit: Where and Why Where does Microtransit Work Best?
- Date: November 2, 2023
Introduction
To understand where microtransit can be the most successful, an agency should analyze the market, existing service, and travel patterns and collect data on various aspects (built environment, land use, etc.) within their service area. This information helps the agency identify areas within their service area that are more likely to support successful microtransit implementation and effectively design service parameters.
The market analysis examines density and demographics to determine where microtransit is likely to succeed. This analysis is usually made up of two components:
- Transit Potential – A measure of population density and employment density.
- Transit Need/Propensity – A measure of population subgroups (e.g., older adults, low-income households, zero-car households) who are more likely to use transit.
The service analysis evaluates the productivity of the current transit system, focusing on attributes such as ridership and level of service, as well as highlighting facilities that could enhance multimodal connections with microtransit services. An analysis of travel patterns also helps the agency understand how riders are moving throughout a study area, where they are going, and how they could potentially benefit from the new service.
With the information gained from both the market and service analyses, the agency is then able to identify how a zone would most likely be used (i.e., new service area, service replacement, FM/LM) and refine the zones (determine the boundaries and hours of operation, identify any trip restrictions).
Market Analysis and Microtransit Suitability
The first step in the transit planning process—for any mode—is to understand the demand for transit service throughout the study area. By analyzing the density and demographics of the region, agencies can estimate who is most likely to need and use transit. Density and demographic data are usually taken from the U.S. Census, including the American Community Survey (ACS) and Longitudinal Employer-Household Dynamics (LEHD) datasets. These surveys include population, jobs, and demographic estimates, including income, age, and vehicle ownership data. Both ACS and LEHD data are available to download online for free. If rural and smaller providers lack the resources to conduct data analysis, there are free-to-use applications, such as Google Earth, that allow users to create basic geographic information system (GIS) route alignments and stop points; and web-based tools, such as Census Reporter and OnTheMap, that allow for visualizing Census data.
The N-CATT Data Practices Guidebook helps transit agencies understand where data can help them, and how to begin the process of working work with it. Chapter 3: Open Data explains how transit agencies can benefit from accessing external open databases, including Census data. The Guidebook also explains how open-source software can help agencies analyze socioeconomic, travel, and spatial data.
Using demographic and employment data, agencies can map the transit potential and transit need/propensity to determine the most effective type of transit. For example, high-frequency fixed-route service is most effective in areas with high transit potential and high transit need/propensity. Microtransit is most suitable in areas with high transit need/propensity and low transit potential, that is, areas with a high proportion of populations likely to use transit and low density route alignments and stop points; and web-based tools, such as Census Reporter and OnTheMap, that allow for visualizing Census data.Using demographic and employment data, agencies can map the transit potential and transit need/propensity to determine the most effective type of transit. For example, high-frequency fixed-route service is most effective in areas with high transit potential and high transit need/propensity. Microtransit is most suitable in areas with high transit need/propensity and low transit potential, that is, areas with a high proportion of populations likely to use transit and low density.
Density
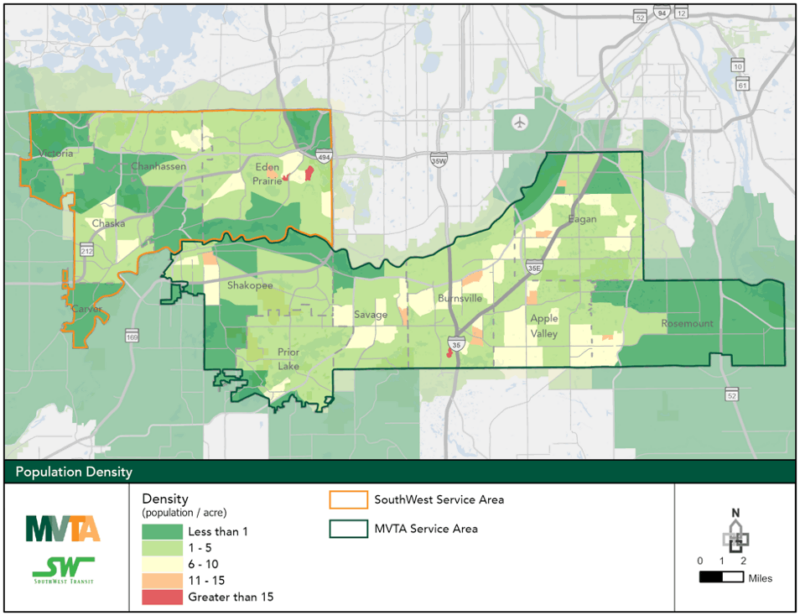
One of the most critical factors impacting transit demand is the number of people and jobs within walking distance of transit services. This metric is usually represented by a combination of population and employment densities, also known as transit potential. Transit service is generally most effective in areas with a higher concentration of residents and/or jobs. Typically, a density greater than five people and jobs per acre is needed to support fixed-route transit service. Various modes of transit can serve areas with high transit potential. Areas with medium-to-low transit potential are less suitable for fixed-route transit and are good candidates for microtransit. Depending on data availability, an agency can also consider analyzing future population and employment densities from travel demand models. Figure 11 shows an example of population density, employment density, and transit potential maps.
Population Density
Population density measures the number of people who live in a determined geographic area. It is usually calculated at the Census block or block group level and by acre or square miles.
Employment Density
Employment density measures the number of people who work in a determined geographic area and is also usually calculated at the Census block or block group level by acre or square miles. Because people who work low-wage jobs are more likely to use transit than those with a higher income, an agency can also analyze low-wage employment density to understand better where transit-oriented populations work.
Figure 11: Population Density, Employment Density, and Transit Potential (Population Density Plus Employment Density) in Suburban Minneapolis and Saint Paul
Transit Need/Propensity
Certain population subgroups, determined by demographic or socio-economic characteristics, are more likely to use or rely on transit because they lack access to a vehicle or cannot or choose not to drive for other reasons. Therefore, understanding where transit-oriented populations live can assist agencies in identifying where transit service is needed the most, and were it has the largest customer base. An example of a transit need map is shown in Figure 12. While not exhaustive, a list of transit-oriented populations includes Title VI protected classes, such as Low-Income and Non-White, and other groups as listed.
Non-White Population Density
Communities of color make up a majority (60 percent) of transit riders in the United States. Black/African American riders comprise the largest single group (24 percent) within communities of color, compared to 12 percent of the U.S. population.
Low-Income Population Density
Low-Income households are more likely to depend on transit as a means of affordability and lack of access to a vehicle.
People with Disabilities Density
Disabled people are more likely to use transit because they may not be able to operate a personal vehicle.
Limited English Proficiency (LEP) Population Density
People with LEP are more likely to take transit than English speakers, with Census and survey data showing this group is three times as likely as the general population to ride buses.[2]
Zero-Car or One-Car Household Density
Households without access to personal vehicles are more likely to use transit daily as a method of transportation.
Youth/Young Adult Population Density
Younger children and teenagers who might not yet be able to drive or have access to a car can use transit as a means of independent travel. Younger adults may have lower incomes and not own or have access to a personal vehicle.
Older Adult Population Density
Older adults, those aged 65 years or older, are more likely to use transit because they are either unable to drive or are uncomfortable doing so.
Figure 12: Transit Need in Upper Bucks County, Pennsylvania

Microtransit Sustainability Ananlysis
Microtransit is most suitable in areas where people are more likely to use transit (higher transit need/propensity), and fixed-route service is less likely to be productive (lower transit potential). Using a bivariate analysis is a helpful way to visualize where microtransit could be suitable throughout a study area. Bivariate analysis is a way to map two variables and analyze their relationship. In this case, transit need/propensity is compared to transit potential, allowing each area to be categorized into one of the quadrants shown in Figure 13 based on their scores within each metric. An area with high transit potential and high transit need/propensity, Quadrant 1, is more suitable for higher-frequency fixed-route service. An area with high transit potential but lower transit need/propensity, Quadrant 2, could be suitable for moderate express or feeder fixed-route service because of the higher density. An area with low transit potential and low transit need/propensity, Quadrant 3, is suitable for interventions to improve FM/LM connections and pedestrian infrastructure. An area with low transit potential and high transit need/propensity, Quadrant 4, is most suitable for microtransit. Because many small urban and rural agencies serve large, low to medium density areas, a significant share of their service areas may fall in Quadrants 3 and 4.
Figure 13: Microtransit Suitability Bivariate Graph

Zone Development
Microtransit can be tailored in its design to better match the specific needs of each zone and the agency’s goals. Once high-level areas suitable for microtransit are identified throughout a study area, an analysis can be conducted to prioritize zones for implementation. Once the zones are identified for future implementation and classified according to the desired use cases, zone parameters such as boundaries and hours of service need to be defined. These processes are described more fully in this section.
Zone Prioritization
The first step is to analyze factors in each zone that make microtransit more successful. Analyzing characteristics about existing service, the built environment, land uses, and activity generators allows an agency to determine which zones should be prioritized over others. For example, microtransit is more likely to succeed in zones with lower intersection densities, a higher proportion of residential areas, and a higher concentration of activity generators.
Existing Service
Ridership data is key to assessing the performance of existing fixed-route services and understanding how passengers might be using demand-response and paratransit services. Ridership data can be collected manually or passively, using automatic passenger count (APC) data. Manual ridership data collection includes the use of ridechecks, counts of activity at each stop of sampled trips, electronic passenger counters, buttons that operators press for each boarding and alighting in fixed-route services, or datasets of demand-response trips.[1] Ridership data, such as total ridership, passengers per revenue mile, passengers per revenue hour, and even origin-destination (OD) data, will help the agency understand underutilized capacity and capacity constraints. Understanding this information is helpful if the microtransit service is intended to replace a portion of the fixed-route service or supplement demand-response or paratransit services.
OD data captures how riders use transit to make their trips. Agencies can analyze OD data for not only general travel but on existing demand-response and paratransit services to understand how riders may use microtransit. Agencies can also use OD data to analyze how riders travel in the area and what percentage of trips are internal or external to the area. OD data can be collected through onboard customer surveys, synthesized using APC data in conjunction with stop location data, demand-response or paratransit scheduling and dispatching data, or calculated using aggregate cellphone location data.[
Agencies should also consider transit connections at stops, stations, or transit centers in the zone and multimodal connections. If planning an FM/LM connection service, agencies will need to determine which transit facilities to serve. Also, existing park-and-ride facilities utilization can inform the feasibility of FM/LM connections.
Built Environment
Fixed-route bus service can be challenging to operate in certain areas based upon roadway conditions or network configuration. For example, hilly terrain, cul-de-sacs, winding circuitous streets, and walled communities make it hard for a bus to navigate through a community. Additionally, pedestrian infrastructure, such as sidewalks, crosswalks, and signalized intersections, is essential to ensuring that pedestrians can safely and easily walk to transit facilities. Lower intersection densities (low number of intersections per area) often mean the neighborhood has larger blocks with fewer pick-up points and fewer direct paths between points for fixed-route transit, leading to less efficient fixed-route service. Intersection densities can be calculated using Topologically Integrated Geographic Encoding and Referencing (TIGER) shapefiles on road networks. Fortunately, because microtransit is a curb-to-curb service, it can operate in areas with less connected road networks and a less transit-oriented built environment.
Land Use
According to the Department of Transportation National Household Travel Survey, about 18 percent of annual miles traveled per person per year are to/from work, while 60 percent are for shopping, errands, school, and social purposes.[2] Therefore, areas with higher residential land uses are more likely to generate more trips than employment areas. The ratio of jobs to population within a geographic zone is a simple way to infer land use. This metric can be used to prioritize zones with higher proportions of residential use that are more likely to generate more trips. This ratio can be calculated using the population and employment numbers used to measure density, referenced in in Density.
Activity Generators
Activity generators are locations that are more likely to generate a trip. They include origins, such as housing complexes, and destinations, such as grocery stores, shopping centers, community centers, and schools. A higher density of activity generators suggests that more trips can be grouped together and completed within a zone. A zone intended for general circulation should include these activity generators to ensure someone coming from their house has access to different trip types. These points of interest can be identified through searches on Google Maps and downloaded using browser-based scraping tools without code or special software.
Zone Classification
After prioritizing the zones according to metrics of each of the five factors identified in Zone Prioritization, zones can be classified by types of service, i.e., use case. Evaluating the prioritization data and qualitatively evaluating local nuances can help inform the best use case for each zone. Some metrics are more relevant to specific use cases, such as transit connections for FM/LM connections or low ridership for underperforming fixed-route replacement. Table 5 shows the prioritization metrics’ ideal values for the three most common use cases.
Many metrics’ ideal values vary use case by use case. For example, a high percentage of internal trips is desirable when a zone is meant to expand service coverage or replace an entire bus route, but not when a zone use case is to promote FM/LM connections. For an FM/LM connector zone, agencies should select a transit facility that has higher ridership activity and allows for connections to other routes or modes. In this case, most trips should not be completed inside the zone, and rather, a rider should start or end at the zone and use transit to complete the rest of the trip.
| Factor | Use Case | ||
| Transit Coverage/Hours Expansion | Underperforming Transit Service Replacement | First Mile/Last Mile Connector | |
| Existing Service |
|
|
|
| Built Environment |
|
|
|
| Land Use |
|
– |
|
| Activity Generators |
|
– | – |
Zone Refinement
With zones prioritized and classified according to the desired use case, zones can be refined in size, design, service hours, wait times, and restrictions.
Boundaries
The size of a microtransit zone depends on the expected level of demand, the known markets within it, and the desired wait times. The size of the zone also depends on the number of vehicles the transit agency is willing to operate. A common recommendation is to set small service zones, ranging between five and seven square miles, to ensure efficient service.[1] A smaller zone, with therefore shorter trips, makes trips easier to schedule and ensures fewer miles of empty vehicles.
For simplicity, some zones coincide with political boundaries or geographical features, such as major roads, waterways, or residential communities. If the agency also operates fixed-route service, boundaries should be designed to provide complementary service rather than overlapping fixed-route service.
Design
Zone design depends on the microtransit service’s goals and the community’s needs and relates to Chapter 1: Service Delivery Types. The following are potential zone design models:
- Zone-based: Rides are provided between points anywhere within the zone.
- Corridor-based: Rides are provided along a specific corridor, so pick-ups and drop-offs must be along the corridor. This design is typically used if microtransit is replacing fixed-route service.
- Hub-based: Rides are provided between specific hubs, usually transit stops or activity generators.
- Hybrid: A combination of the above service designs. For example, a service can use a zone-based design with hubs outside of the zone, such as transit centers.
While zone- and corridor-based designs models fall under a point-to-point microtransit service delivery type, hybrid zone designs are used for both FM/LM and hub-spoke delivery types.
Hour of Service
Agencies can analyze their ridership data and OD surveys to base service hours on expected demand by hour of the day. If the agency also operates a fixed-route service, microtransit service should operate with the same span if designed to offer FM/LM connections or operate in complementary hours if the goal is to expand service hours or replace fixed-routes services in times of low productivity.
Wait Times
Wait time is an important metric because it influences the quality of service. Wait time is a function of the size of the zone and the number of vehicles, so a larger zone needs more vehicles to keep wait times reasonable. Agencies can refine the zone size around their desired wait time.[1]
Trip Restrictions
In some zones, the microtransit software can restrict certain trips. For example, suppose a trip can be completed more efficiently on fixed-route service. In that case, the application can direct the rider to the nearest mode to complete their trip.
Case Example
As sub-recipients in the FTA’s MOD Sandbox Program, Sound Transit and King County Metro in the Puget Sound region in Washington launched a pilot project to increase transit access through FM/LM microtransit service. The final report details their methodology to design and prioritize zones:[1]
- Initial List and Screening: After compiling an initial list of transit facilities served by Sound Transit and King County Metro, information compiled for consideration included modes serving the facilities, parking availability, and nearby land uses.
- Market Analysis: Staff used Census data to measure demographics, including minority, low-income, and limited English proficiency populations within approximately two miles of the transit facilities. They also measured population and employment density for each of the potential pilot locations.
- Zone Prioritization: The above data, along with daily boardings and alightings ridership data, was used to give each pilot location a score. The pilot locations with the top scores were selected.
Figure 14: Sound Transit Light Rail
Source: Sound Transit
Key Takeaways
Microtransit is best suitable to serve areas with high transit needs but dispersed demand. Microtransit can provide service coverage to those low-density areas with irregular street networks, hilly topography, or other traits that lead to a challenging fixed-route transit operation and performance. This chapter also described the process of zone development and how those should be designed with respect to the agency’s goals and the customer’s preferences and needs. Also, understanding the existing service and aspects of the built environment, land use, and activity generators is critical to prioritizing microtransit zones. Prioritization metrics will guide a zone classification in terms of the desired use case, which will, in turn, allow for the definition of a zone size, design, and other characteristics. Familiar with the market analysis and use case needs, the next step is to be aware of a community’s needs and desires to continue planning for the appropriate transit service.
The following checklist highlights aspects to consider on where microtransit works best.